

Ultrasound contrast microbubbles to predict the microsphere distribution during transarterial radioembolization with holmium microspheres, an in vitro proof of concept study
- PMID: 40384014
- PMCID: PMC12090288
- DOI: 10.1080/10717544.2025.2505007
Ultrasound contrast microbubbles to predict the microsphere distribution during transarterial radioembolization with holmium microspheres, an in vitro proof of concept study
Abstract
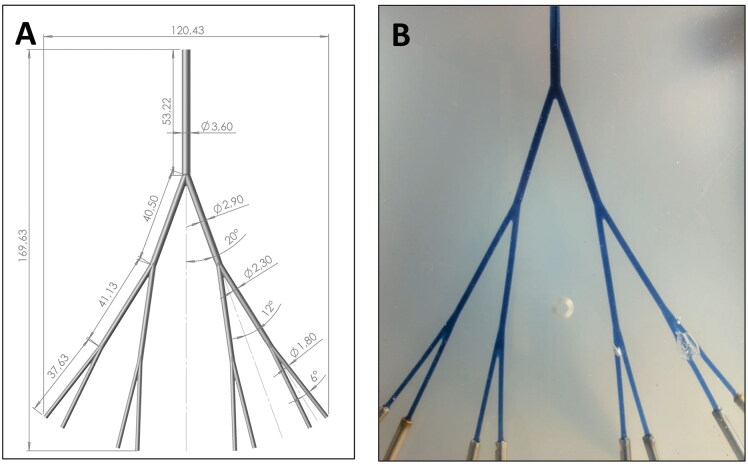
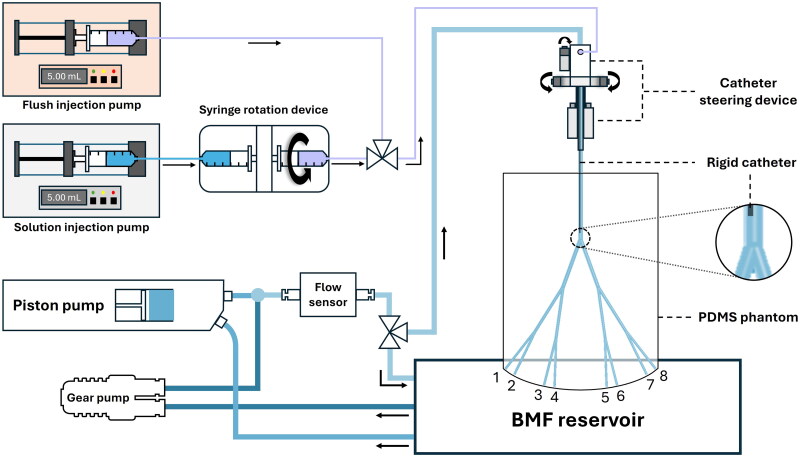
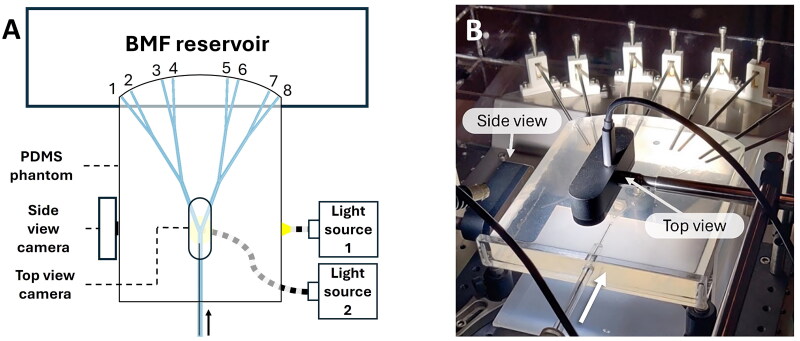
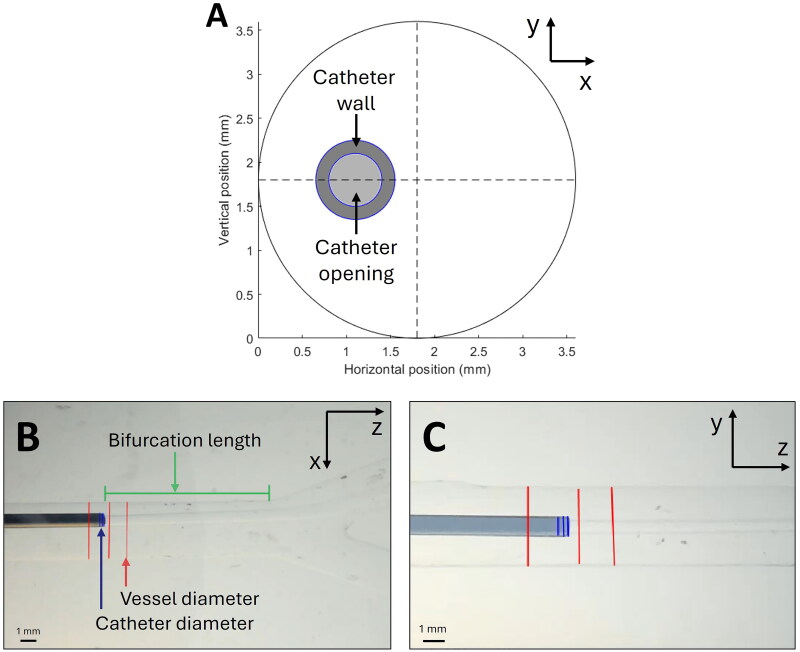
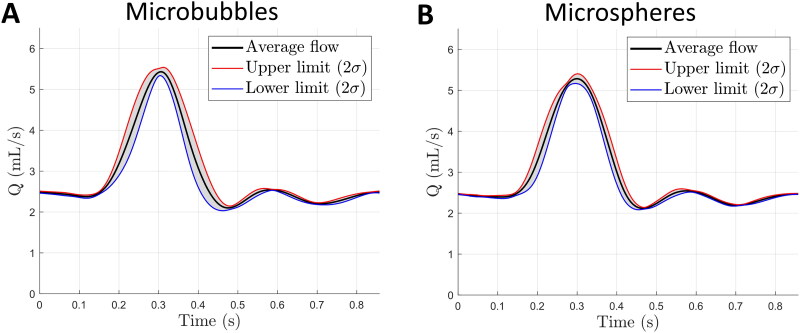
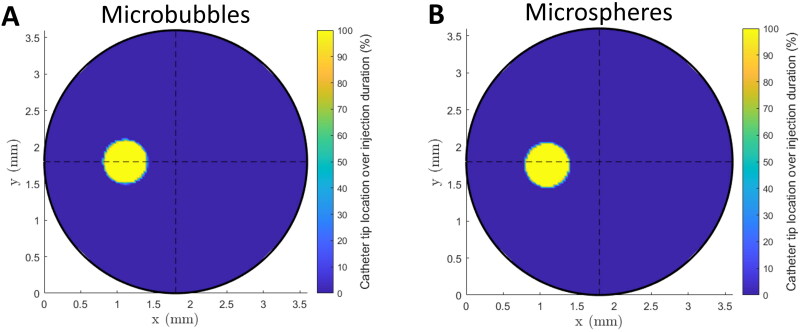
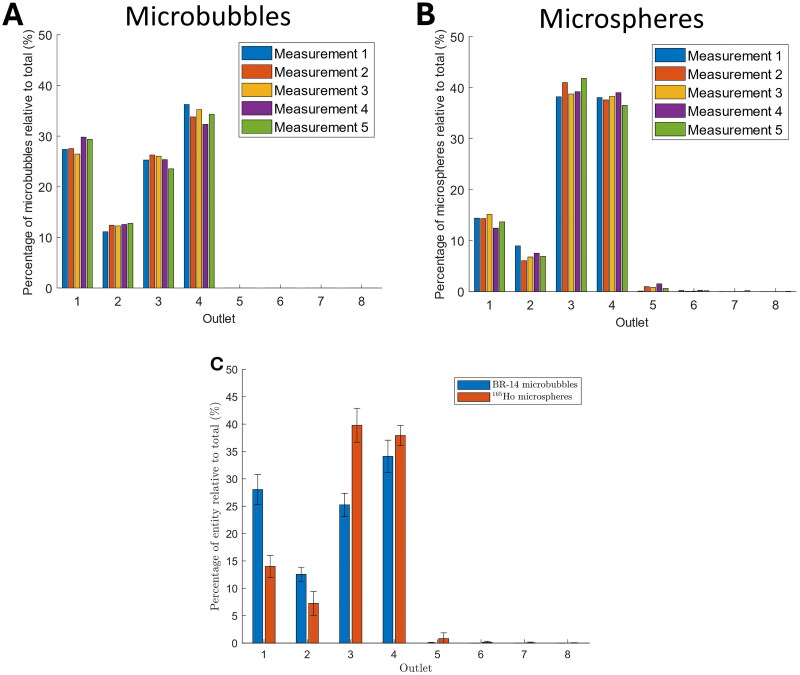
Transarterial radioembolization (TARE) is an established treatment method for non-resectable liver tumors. One of the challenges of the approach is the accurate prediction of the microsphere biodistribution in the liver. We propose to use ultrasound contrast microbubbles as holmium microsphere precursors, which allows real-time prediction of the microsphere trajectories and biodistribution using dynamic contrast-enhanced ultrasound (DCE-US). The immediate goal in this in vitro study was to investigate the predictive capabilities of microbubbles as microsphere precursors. The study was conducted in an experimental in vitro model which represents the bifurcating right branch of the hepatic artery. A controlled injection of experimental BR-14 ultrasound contrast microbubbles and non-radioactive holmium-165 microspheres was performed in separate consecutive experiments in an arterial flow phantom. The microbubbles and microspheres were collected separately at the outlets of the phantom and counted using a Coulter counter to determine their distribution over the different outlets. The flow profile, the injection velocity, and the catheter position were monitored during the measurements to ensure stability. The results showed a good correlation between the microbubble and the microsphere distributions (p = 0.0038, r = 0.88) measured at the outlets. Differences in the distributions could be attributed to the characteristics of microbubbles and microspheres alone (e.g. particle size and concentration), since critical parameters were kept stable between the two experiments. The current in vitro study provides confidence that the microsphere biodistribution can be predicted using contrast microbubbles. The comparison provided by this study forms a foundation for the development of a DCE-US guided TARE treatment.
Keywords: In-vitro model; biodistribution; holmium microspheres; particle flow behavior; transarterial radioembolization; ultrasound contrast microbubbles.
Conflict of interest statement
No potential conflict of interest was reported by the authors.
Figures
Similar articles
-
Intraprocedural MRI-based dosimetry during transarterial radioembolization of liver tumours with holmium-166 microspheres (EMERITUS-1): a phase I trial towards adaptive, image-controlled treatment delivery.Eur J Nucl Med Mol Imaging. 2022 Nov;49(13):4705-4715. doi: 10.1007/s00259-022-05902-w. Epub 2022 Jul 13. Eur J Nucl Med Mol Imaging. 2022. PMID: 35829749 Free PMC article. Clinical Trial.
-
In Vitro Investigation of Microcatheter Behavior During Microsphere Injection in Transarterial Radioembolization.J Endovasc Ther. 2025 Feb 24:15266028251318953. doi: 10.1177/15266028251318953. Online ahead of print. J Endovasc Ther. 2025. PMID: 39989304
-
Improving MRI-based dosimetry for holmium-166 transarterial radioembolization using a nonrigid image registration for voxelwise calculation.Med Phys. 2023 Feb;50(2):935-946. doi: 10.1002/mp.16014. Epub 2022 Oct 24. Med Phys. 2023. PMID: 36202392
-
Holmium-166 Microsphere Radioembolization of Hepatic Malignancies.Semin Nucl Med. 2019 May;49(3):237-243. doi: 10.1053/j.semnuclmed.2019.01.008. Epub 2019 Feb 1. Semin Nucl Med. 2019. PMID: 30954190 Review.
-
Transarterial radioembolization: a systematic review on gaining control over the parameters that influence microsphere distribution.Drug Deliv. 2023 Dec;30(1):2226366. doi: 10.1080/10717544.2023.2226366. Drug Deliv. 2023. PMID: 37341184 Free PMC article.
References
-
- Aramburu J, Antón R, Bernal N, Rivas A, Ramos JC, Sangro B, Bilbao JI.. 2015. Physiological outflow boundary conditions methodology for small arteries with multiple outlets: a patient-specific hepatic artery haemodynamics case study. Proc Inst Mech Eng H. 229(4):291–306. doi: 10.1177/0954411915578549. - DOI - PubMed
MeSH terms
Substances
LinkOut - more resources
Full Text Sources
Other Literature Sources