. 2025 Jun;13(3):e70123.
doi: 10.1002/prp2.70123.

Downstream Signaling of Muscarinic M4 Receptors Is Regulated by Receptor Density and Cellular Environment

Affiliations

Downstream Signaling of Muscarinic M4 Receptors Is Regulated by Receptor Density and Cellular Environment

Madeleine Merz et al. Pharmacol Res Perspect. 2025 Jun.

Abstract

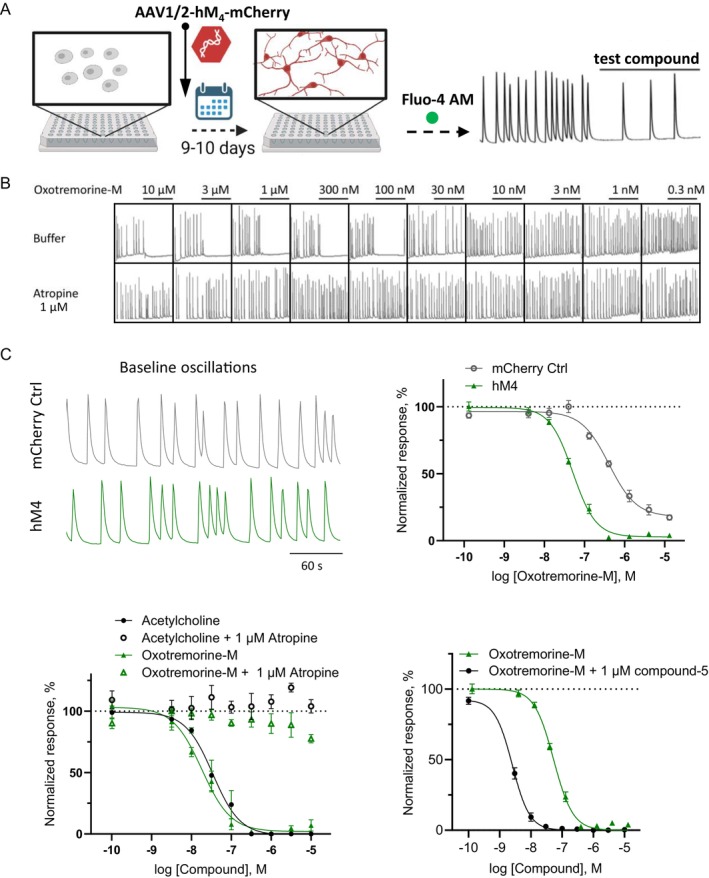
Multiple muscarinic M4 receptor modulators are currently advancing in clinical development for the treatment of positive symptoms in schizophrenia, including agonists and positive allosteric modulators. Considering the importance of comprehending M4 receptor pharmacology for these therapeutic applications, this study investigates M4 receptor signaling pathways upon activation by structurally diverse muscarinic agonists, exploring the role of receptor expression levels and cellular environment on downstream signaling. HEK-293 cells and rat primary neurons expressing human M4 receptors were used to measure the kinetics of cAMP levels and compound effects on neuronal network activity. Receptor expression levels were controlled by a Tet-On system and quantified using a radioactive binding assay. Our findings revealed that most agonists caused a concentration-dependent reduction of cAMP levels (Gi/o) at low concentrations, while inducing an increase in cAMP at higher concentrations (Gs). A less prominent coupling via Gs was observed when receptor density in HEK-293 cells was reduced. In the neuronal assay, most compounds showed consistent inhibition of neuronal activity. A distinct group of agonists displayed a specific profile, with no Gs coupling at high receptor density, partial activation at low receptor density, and low to no effects in the neuronal assay. This study provides a side-by-side comparison of the activity of structurally diverse M4 agonists and highlights compound-specific activation of GPCR intracellular signaling pathways. The data offer new insights into M4 receptor pharmacology that may aid in the development of novel therapies for the treatment of psychiatric diseases.


Conflict of interest statement

M.M., M.P., O.H., U.G., and D.U. are employees of Boehringer Ingelheim Pharma GmbH & Co. KG. All other authors declare no potential conflicts of interest.

Figures

FIGURE 1
FIGURE 1
Biphasic cAMP concentration response in HEK‐293 cells expressing human M4 receptors. Cells were transduced with a genetically encoded cAMP sensor, and kinetic responses were measured using the FLIPR system. (A) HEK293 cells transduced with cADDis sensors: Brightfield image (left), green fluorescence image (middle), and cADDis assay principle (right) (B) Example kinetic traces for cADDis recordings (each trace represents one well) corresponding to application of different concentrations of acetylcholine. After increasing cAMP and reaching a stable level following forskolin addition (arrow 1, 1 μM, downward signal), acetylcholine (arrow 2) reduced cAMP levels in a concentration‐dependent manner (upward signal) at low concentrations and increased them at higher ones. Average data from multiple wells are combined in a single graph (bottom left panel), and curve fit data of maximum fluorescence changes are plotted as a concentration‐response (bottom right panel). Data are normalized to forskolin control (0%) and maximum response to acetylcholine (100%); pEC50 for cAMP decrease was 9.01 ± 0.07, pEC50 for cAMP increase was 6.37 ± 0.07 (n = 4, 3–4 replicate wells per experiment). (C) Preincubation of M4 expressing cells with pertussis toxin (PTX, 0.1 μg mL−1, 24 h) blocked the Gi specific cAMP decrease but did not alter the increase in cAMP (pEC50 = 6.33 ± 0.11; n = 2, 3 wells/experiment). All data presented as mean ± SEM.
FIGURE 2
FIGURE 2
Lower levels of M4 receptor expression in HEK‐293 cells alter signaling pathways corresponding to Gi and Gs protein coupling. Changes in cAMP levels were measured in cells expressing different M4 receptor levels. (A) Specific binding of the radioactively labeled M4 PAM [3H]‐MK‐6884 has been determined in the presence of 100 μM acetylcholine for HEK‐293 cells induced for 2 h, 4 h, 6 h, 8 h, 24 h, and 48 h with a fixed concentration of doxycycline (0.5 μg mL−1). With increasing expression time, binding levels increased. Each datapoint represents mean ± SEM of 3 wells. (B) Binding sites/cells ± SEM plotted from (A): 0.94 × 105 ± 0.03 (2 h), 2.85 × 105 ± 0.04 (4 h), 5.34 × 105 ± 0.10 (6 h), 6.30 × 105 ± 0.19 (8 h), 14.2 × 105 ± 0.2 (24 h) and 16.9 × 105 (48 h). (C) cAMP kinetics of cells induced as in (A) using the cADDis cAMP assay. With lower expression levels, the acetylcholine pEC50 decreased from 9.01 ± 0.07 at 48 h induction to 6.45 ± 0.11 at 2 h induction for the Gi component. It appears that the Gs part is absent at 4 h and 2 h induction times (n = 2–4, 2–4 wells/experiment). (D) Inverse correlations have been observed between the M4 receptor levels and acetylcholine potency (upper panel, for Gi signaling), as well as an increase in cAMP at high agonist levels (lower panel, Gs signaling).
FIGURE 3
FIGURE 3
Chemical structures of compounds used in this study. A structurally diverse set of muscarinic agonists was used to probe activation of M4 receptors. Compound‐5 (PAM) and compound‐6 (agonist) are arbitrary labeled based on the order they appear in the figure. Compound‐110 has been reported previously (see text for reference).
FIGURE 4
FIGURE 4
Reduced M4 receptor expression shifts cAMP signaling profiles of muscarinic agonists. A set of structurally diverse muscarinic agonists has been tested in the cADDis cAMP assay at high (A) and low receptor expression levels (B). (A) Similar to acetylcholine, the other nonselective agonists carbachol, xanomeline, and oxotremorine‐M showed a biphasic CRC (left). A similar profile is seen for the M4 selective compound‐110, whereas clozapine and compound‐6 result in a monophasic curve (right). (B) At lower receptor levels, all curves are shifted to the right, indicating a reduction in potency. Furthermore, the Gs part is always less prominent. All agonists show a similar relative efficacy to acetylcholine except clozapine, which appears as a partial agonist at lower expression. All results were normalized to the maximum effect (100%) produced by acetylcholine at either 48 h (A) or 4 h (B). Data presented as mean ± SEM resulted from n = 2–4 experiments, 2–6 wells/experiment.
FIGURE 5
FIGURE 5
Cyclic AMP recordings in rat primary neurons overexpressing M4 receptors. (A) Transduction of rCNs in culture (left panel) with 150 MOI hSyn‐hM4‐mCherry‐AAV (middle panel) and 2500 MOI Epac1camps‐AAV (right panel) lead to robust expression after DIV14 (bar = 100 μm). (B) hM4 transduced rCNs express low hM4 levels (4.06 × 105 binding sites/cells) equivalent to values seen in HEK‐293 cells induced for 4 h and 6 h. Each datapoint represents mean ± SEM of 3 wells. (C) Traces for oxotremorine‐M, compound‐6 and clozapine applied at 10 μM after perfusion with 3 μM forskolin are shown as mean of multiple experiments. (D) The cAMP response to 10 μM agonist is comparable for oxotremorine‐M, acetylcholine, carbachol, compound‐110 and xanomeline but only a small response can be seen upon compound‐6 and clozapine addition. Data presented as mean ± SEM resulted from n = 2–5, 2–5 wells/experiment, **p < 0.01, ***p < 0.001; Brown‐Forsythe and Welch ANOVA test, followed by Dunnett's T3 multiple comparisons test with α of 0.05.
FIGURE 6
FIGURE 6
Spontaneous Ca2+ oscillations can be used to study the effects of M4 receptor activation. The effect of M4 receptor‐dependent GIRK channel activation on neuronal activity was measured by assessing the modulation of spontaneous Ca2+ oscillations in rCNs transduced with hM4 receptors. (A) Protocol used to record Ca2+ signals with the Fluo‐4 AM Ca2+ dye in rCNs that have been transduced with AAV1/2‐hM4‐mCherry to express the M4 receptor. Baseline activity is recorded before the addition of a test compound, and changes in oscillation frequency are investigated. Illustration was made with BioRender. (B) Example FLIPR recordings showing spontaneous Ca2+ peaks which reduced their frequency upon addition of different concentrations of oxotremorine‐M. Preapplication of atropine prevented inhibition of the Ca2+ peaks. (C) Example traces of baseline oscillations of neurons transfected with the mCherry control virus versus the hM4 expressing virus (top left panel). In a control experiment, oxotremorine‐M blocked Ca2+ oscillations in a concentration‐dependent manner with a higher potency and maximum effect in the hM4 expressing neurons (pEC50 = 7.29 ± 0.03, Emax = 97% block) compared to the control (pEC50 = 6.39 ± 0.06, Emax = 82% block, top right panel, n = 2, 5 wells/experiment). Reduction in oscillations was not present when 1 μM atropine was added, neither in combination with oxotremorine‐M nor with acetylcholine, demonstrating the specific nature of muscarinic activation (bottom left panel). pEC50 of the agonists without atropine was 7.74 ± 0.07 for oxotremorine‐M and 7.47 ± 0.08 for acetylcholine (n = 1–2, 3 wells/experiment). The effect of oxotremorine‐M was enhanced when applied in combination with the M4 selective PAM compound‐5 (1 μM, bottom right panel, n = 2, 3‐5wells/experiment).
FIGURE 7
FIGURE 7
Differential effects of muscarinic agonists on blocking spontaneous neuronal activity. (A) All tested muscarinic agonists fully blocked the neuronal Ca2+ oscillations, except for compound‐6, which showed only a partial block, and clozapine, which did not induce any effects. (B) Combined application with compound‐5 (PAM) showed no enhancement of inhibition for clozapine (left panel) or compound‐6 (right panel, n = 2, 3–5 wells/experiment).
FIGURE 8
FIGURE 8
Predicted binding modes of clozapine and compound 6. (A) Chemical structures; (B) Binding model of compound 6 with clozapine superposed. Shown are pocket residues that are either not fully conserved (see sequence alignment) in muscarinic acetylcholine receptors, or that form key ligand‐interactions (Asp 112, Asn 117, Tyr 439). Compound 6 is anchored at the bottom of the orthosteric pocket by an H‐bond to Asn 117. Both compounds have their basic nitrogen atoms in proximity to the negatively charged carboxylate group of Asp 112; (C) Rotated orientation highlighting the movement of Tyr 439 induced by compound 6. This opens the “tyrosin lid” of the orthosteric pocket and allows compound 6 to partially occupy the extracellular vestibule (ECV). (D) Superposition of the cryo‐EM structure of M4 in complex with acetylcholine (cyan; [27], PDB code: 7TRS) with the clozapine binding model (green). The positive allosteric modulator (PAM) LY2033298 was superposed from 7TRP.pdb [27] to indicate the PAM binding site in the ECV. Clozapine occupies significantly more space in the orthosteric binding pocket (surface shown) than acetylcholine. It packs tightly against residues that contribute to the PAM binding pocket (Leu 190, Tyr 113, Tyr 439), influencing their conformational properties. (E) Same as (D), without the surface of the orthosteric pocket, making the clozapine‐induced movement of Tyr 113 more obvious. Compound 6 is superposed from our binding model to show that it partially occupies the PAM binding site. F. Segments of the sequence alignments of the M1–5 receptors that contain residues located within 6 Å from compound‐6 (*) or clozapine (&) in the predicted binding complexes with M4. Nonconserved M4 residues are specified and highlighted by red symbols (*, &).

Similar articles

References

    1. Caulfield M. P. and Birdsall N. J., “International Union of Pharmacology. XVII. Classification of Muscarinic Acetylcholine Receptors,” Pharmacological Reviews 50 (1998): 279–290. - PubMed
    1. Brown D. A., “Muscarinic Acetylcholine Receptors (mAChRs) in the Nervous System: Some Functions and Mechanisms,” Journal of Molecular Neuroscience 41 (2010): 340–346. - PubMed
    1. Nathanson N. M., “Synthesis, Trafficking, and Localization of Muscarinic Acetylcholine Receptors,” Pharmacology & Therapeutics 119 (2008): 33–43. - PMC - PubMed
    1. Thiele A., “Muscarinic Signaling in the Brain,” Annual Review of Neuroscience 36 (2013): 271–294. - PubMed
    1. Felder C. C., Goldsmith P. J., Jackson K., et al., “Current Status of Muscarinic M1 and M4 Receptors as Drug Targets for Neurodegenerative Diseases,” Neuropharmacology 136 (2018): 449–458. - PubMed

LinkOut - more resources