. 2025 May;14(5):e70087.
doi: 10.1002/jev2.70087.

Defining Biological Variability, Analytical Precision and Quantitative Biophysiochemical Characterization of Human Urinary Extracellular Vesicles

Affiliations

Defining Biological Variability, Analytical Precision and Quantitative Biophysiochemical Characterization of Human Urinary Extracellular Vesicles

Edita Aksamitiene et al. J Extracell Vesicles. 2025 May.

Abstract

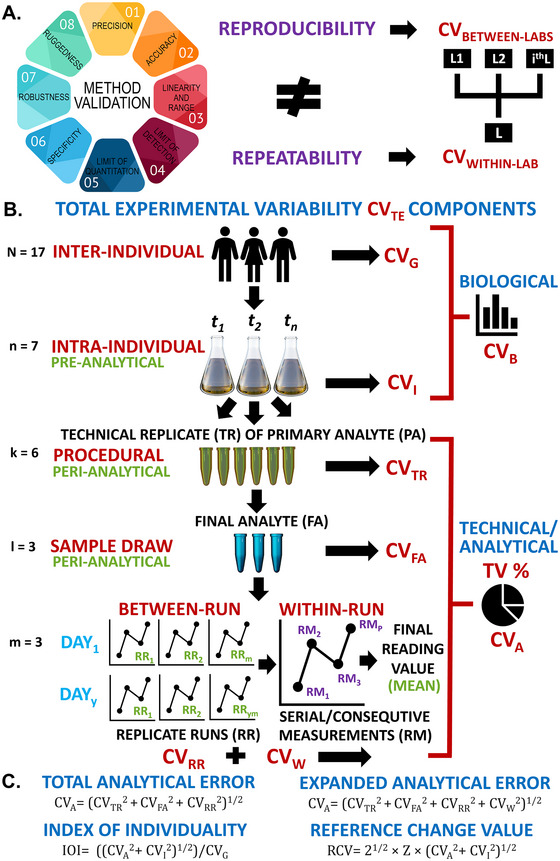
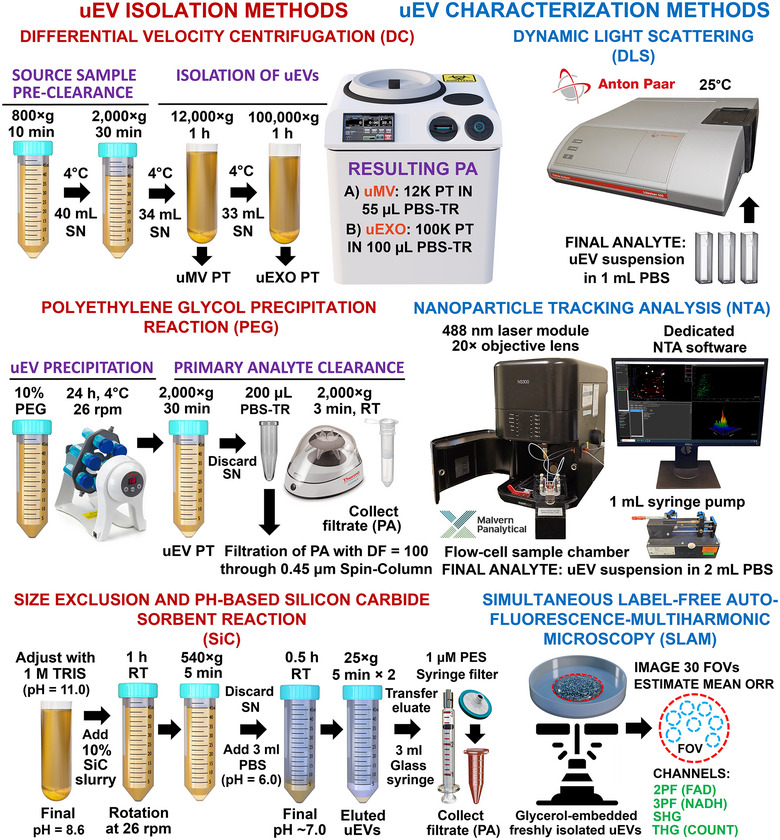
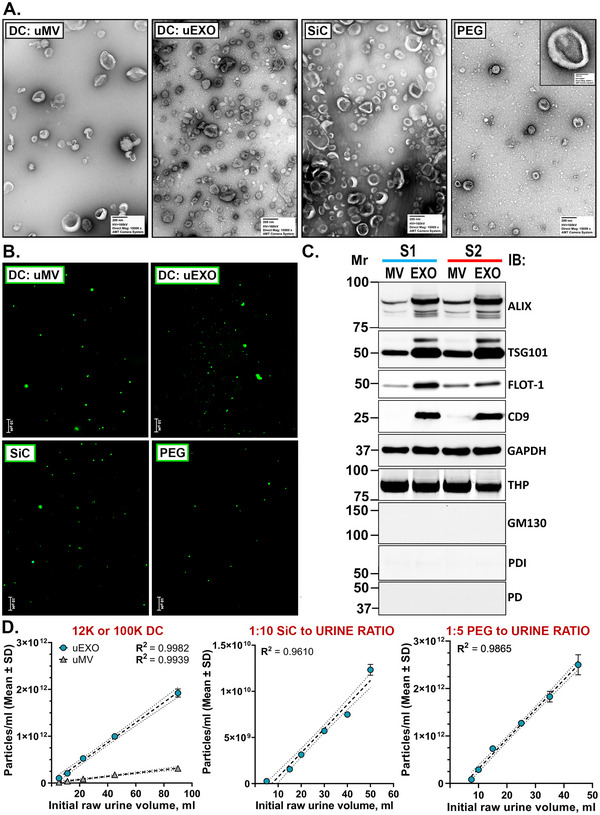
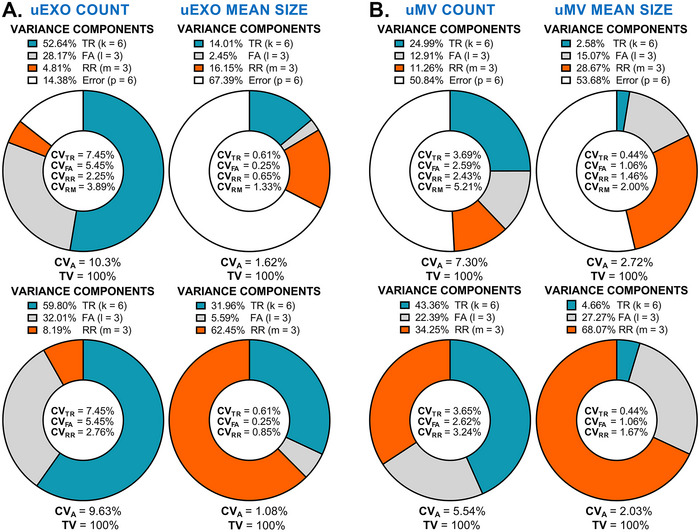
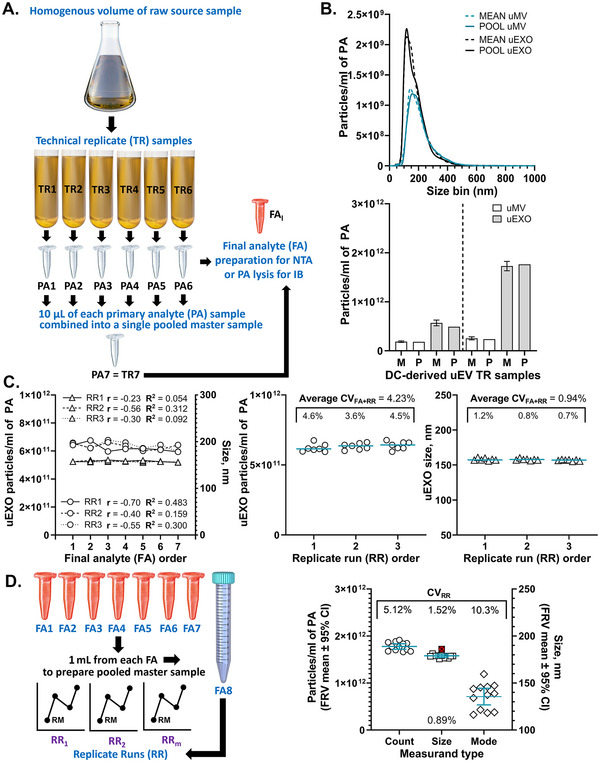
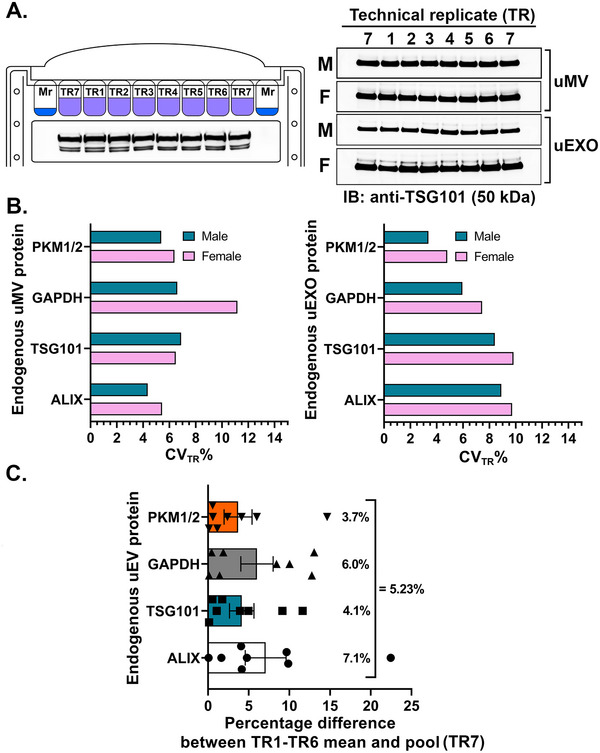
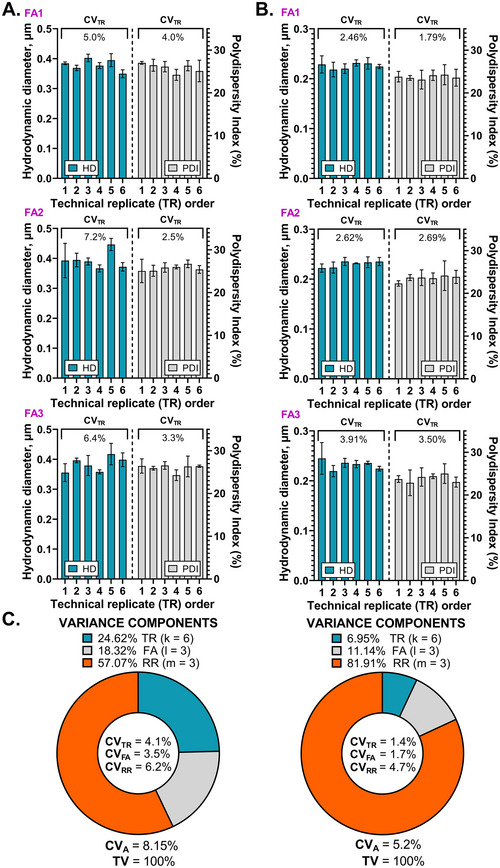
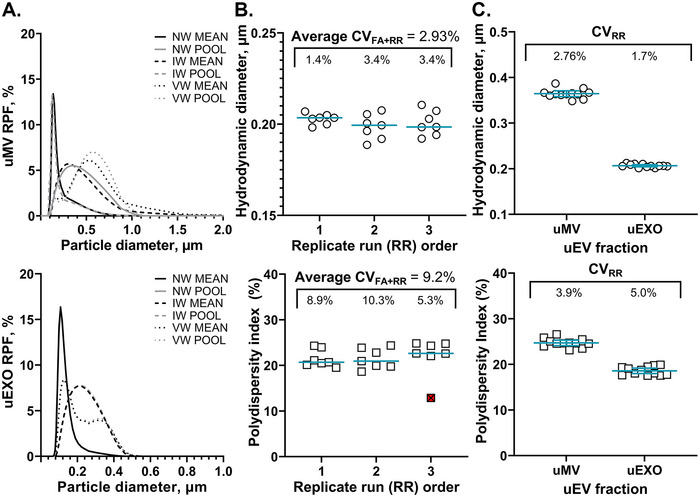
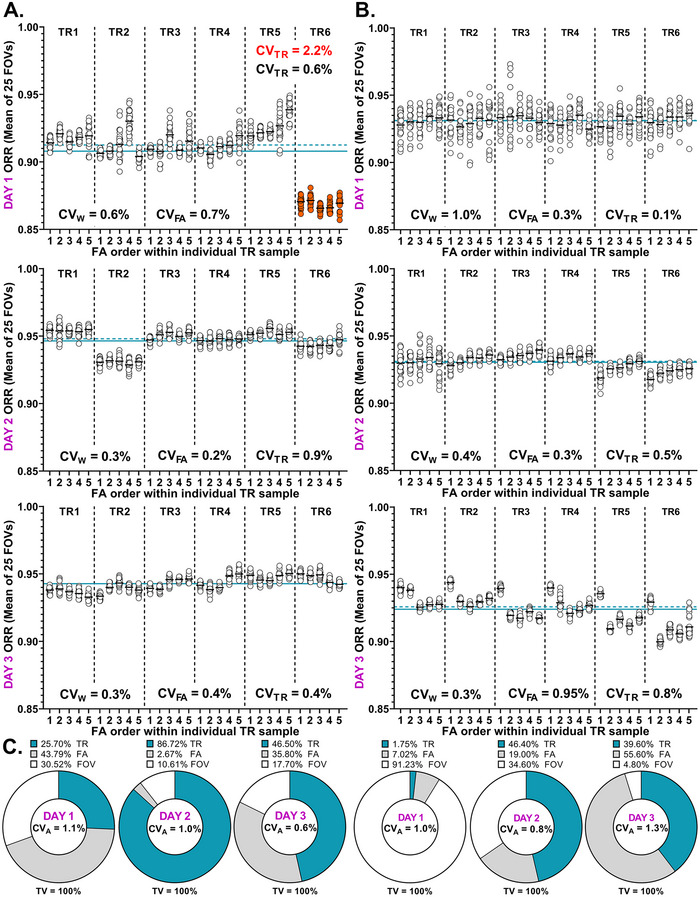
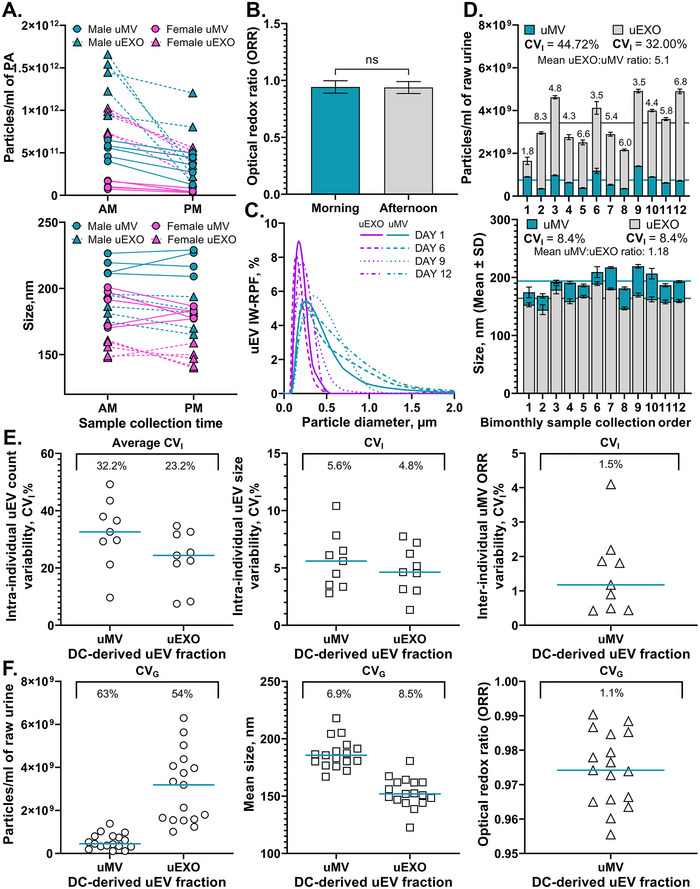
The magnitude of combined analytical errors of urinary extracellular vesicle (uEV) preparation and measurement techniques (CVA) has not been thoroughly investigated to determine whether it exceeds biological variations. We utilized technical replicates of human urine to assess the repeatability of uEV concentration and size measurements by nanoparticle tracking analysis (NTA) following differential velocity centrifugation (DC), silicon carbide, or polyethylene glycol uEV isolation methods. The DC method attained the highest precision. Consequently, DC-derived uEV size, most abundant protein levels, and optical redox ratio (ORR) were further assessed by dynamic light scattering (DLS), immunoblotting or multi-photon (SLAM) microscopy. Procedural errors primarily affected uEV counting and uEV-associated protein quantification, while instrumental errors contributed most to the total variability of NTA- and DLS-mediated uEV sizing processes. The intra-individual variability (CVI) of uEV counts assessed by NTA was smaller than inter-individual variability (CVG), resulting in an estimated index of individuality IOI < 0.6, suggesting that personalized reference interval (RI) is more suitable for interpretation of changes in subject's test results. Population-based RI was more appropriate for ORR (IOI > 1.4). The analytical performance of DC-NTA and DC-SLAM techniques met optimal CVA < 0.5 × CVI criteria, indicating their suitability for further testing in clinical laboratory settings.

Keywords: analytical precision; biological variability; biomarker quantitation; biophysiochemical properties; coefficient of variation; repeatability; urinary extracellular vesicles.


Conflict of interest statement

The authors declare no conflicts of interest.

Figures

FIGURE 1
FIGURE 1
Study design and concepts. (A) Assessment of precision expressed as coefficient of variation percentage (CV%) is a part of the standard method validation process. Repeatability (short‐term precision), which tests the variability in repeated measurements on the same item under the same conditions—same operator, instrument, method, laboratory and over a short timeframe (often minutes to hours) is not equal to reproducibility (long‐term precision), which tests the consistency of data obtained at different laboratories/sites. (B) An experimental design for evaluation of the total experimental variability (CVTE) of biophysical biofluid‐derived extracellular vesicle (EV) property assessment. Biological inter‐individual (CVG) and intra‐individual (CVI) variations are part of natural physiological fluctuations and inherent genetic/environmental differences in the analyte of interest. Variations in the procedural isolation of primary analyte (PA) (estimated by CVTR), pipetting/sample draw (CVFA), and instrumental sample read (between‐run (CVRR) and within‐run (CVW)) are main sources of gross technical/analytical error (CVA). In this study, the short‐term intra‐laboratory precision was assessed when multiple EV‐enriched PAs were prepared from k number of technical replicates (TRs), that is, multiple sub‐samples of one biological sample (urine) collected at the defined time of day by one selected EV isolation method of choice. These were further consecutively sampled and aliquoted for l number of times to prepare appropriately diluted final analytes (FA) suitable for downstream analysis. For each FA sample, m number of replicate runs (RRs) were carried out on the same day to measure the concentration, size or optical redox ratio (ORR) of either small or large urinary EVs (uEVs). Each RR consisted of p number of serial repeated measurements (RMs). Their values were averaged at the end of data capture cycle to yield one final reading value (FRV), which is mean. Intermediate precision is typically evaluated on stable samples that would be analyzed by m number of RRs on y number of different days. (C) Uncertainties were combined using the square root of the sum of squares method, commonly referred to as combining uncertainties in quadrature. A nested random factor ANOVA was applied to partition the total variance (TV) into individual variance components and to estimate the relative contribution of each hierarchical factor (TR, FA, RR with/without RM) to the overall measurement precision. Calculating both biological (CVB) and analytical (CVA) variability of the analyte of interest in healthy individuals is critical for establishing the reference change value (RCV) and the index of individuality (IOI). If the change in a patient's clinical test results exceeds the RCV, it suggests a significant alteration beyond normal fluctuations. IOI is used to determine the most appropriate use of either personalized or population‐based reference intervals (RIs).
FIGURE 2
FIGURE 2
Urinary extracellular vesicle (uEV) isolation and characterisation methods used in this study. uEVs isolated by differential velocity centrifugation (DC), polyethylene glycol (PEG) co‐precipitation or silicon carbide (SiC) sorbent pH‐sensitive binding‐based methods (right panel) were characterised by the dynamic light scattering (DLS), nanoparticle tracking analysis (NTA), or inverted simultaneous label‐free autofluorescence multi‐harmonic (SLAM) microscopy techniques (left panel) that measured average uEV particle size (hydrodynamic diameter), polydispersity index (PDI), concentration and metabolic activity (ORR computed from FAD/(NADH+FAD) formula) either in liquid or semi‐solid phase samples, respectively. 2PF = two‐photon autofluorescence, 3PF = three‐photon autofluorescence, FA = final analyte, FOV = field of view, ORR = optical redox ratio, PBS = phosphate‐buffered saline, PBS‐TR = phosphate buffered saline and trehalose buffer, PT = pellet, RT = room temperature, SHG = second‐harmonic generation, SN = supernatant, THG = third‐harmonic generation.
FIGURE 3
FIGURE 3
A‐C. Prove of urinary extracellular vesicle (uEV) particle existence in the primary analyte samples derived by different uEV isolation methods by ancillary transmission electron microscopy (TEM) (A), fluorescence microscopy (FM) (B) and Western Blotting/Immunoblotting (IB) (C) methods. TEM shows a typical cup‐shape EV morphology (EV drying artefact) at 3200 ms exposure and either medium 15,000× (bar size = 200 nm) or high 43,000× (bar size = 100 nm, inlet image) magnification; IB shows known EV protein biomarker expression such as Alix, TSG101, Flotillin‐1, CD‐9 and PKM1/2 in different subject (S1, S2) uEV samples that are free of Golgi, endoplasmic reticulum or mitochondria organelle contaminants as indicated by the absence of GM130, protein disulfide isomerase (PDI) or pyruvate dehydrogenase (PD) proteins; FM displays green fluorescent signal emitted from SYTO RNASelect‐stained internal uEV nucleic acid (RNA) cargo (bar size = 10 µm). (D) Linear relationship between raw source sample dose (pre‐clarified urine input) and isolated uEV particle concentration (output response) in samples processed by DC (left panel), SiC (middle panel) or PEG (right panel) methods.
FIGURE 4
FIGURE 4
Variance component analysis (VCA) of urinary extracellular vesicle (uEV) concentration and mean size measurements by nanoparticle tracking analysis (NTA) following uEV isolation by differential velocity centrifugation (DC) method. Six technical replicates (TRs, k = 6) of one biological sample (N = 1) were used to isolate urinary exosome (uEXO) (A) or microvesicle (uMV) (B) enriched fractions that were consecutively sampled to prepare three appropriately diluted final analytes (FA, l = 3). Particle concentration (left panels) and mean size (right panels) in each FA were measured over three replicated runs (RRs, m = 3) under identical instrumental data capture and analysis conditions. Expected mean square values were estimated by nested random factor ANOVA to find out how much of the total variance (TV%) in typical NTA results might be attributed to the sample processing (TR) and sample draw (FA) differences and how much to instrumental RR‐associated error, which was calculated either considering (upper panels) or ignoring (bottom panels) random within‐run fluctuations of six 60 s long repeated intra‐FA measurements (RM). Derivative coefficient of variation percentage (CV%) values for individual variance components are shown inside pie charts. Combined analytical precision CVA values are indicated at the bottom of each chart.
FIGURE 5
FIGURE 5
Repeatability of urinary extracellular vesicle (uEV) concentration and size measurements by NTA before and after elimination of procedural sample processing and/or sample draw variations by sample pooling. (A) A diagram showing the principle of biological source sample division and subsequent pooling. (B) Concordance of pooled sample NTA measurement values with the mean of individual technical replicates (TR). Upper panel. NTA particle count and size distribution graph showing the arithmetic mean of six TRs (dashed lines) plotted against pooled TR master sample data (solid lines) for urinary microvesicle (uMV, teal lines) or exosome (uEXO, black lines) enriched fractions separated by differential velocity centrifugation (DC) method. Bottom panel. Bars represent the area under the curve, reflecting total detected particle number per 1 mL of primary analyte (PA). The mean of each individual TR analyte (M) is compared to the corresponding pool of six TRs (P) across two individuals (separated by dashed vertical line). (C) Repeatability of uEXO measurements by NTA after elimination of procedural sample processing variations. Six TRs (k = 6) were pooled into one master TR7 sample, further used to draw seven final analyte (FA) samples (l = 7). Particle concentration (circle symbols, left Y axis) and mean size (triangle symbols, right Y axis) in each FA were measured over three replicate runs (RRs; m = 3). Readout dependency on FA order is shown in the left panel with corresponding Pearson correlation coefficient (r) and R squared values. Readout dependency on RR order is shown in the middle and right panels. Horizontal line within each RR group represents the mean of 7 FA values for uEXO concentration (middle panel) or size (right panel) measurements. Combined sample draw and instrumental read precision was estimated by single random factor ANOVA and expressed as coefficient of variation percentage (%) CVFA + RR. Differences among FAs accounted for 6.13% and 5.63% of total variance in uEXO counting and sizing procedures, respectively. (D) Repeatability of uEXO measurements by NTA after elimination of procedural and sample draw variations. Six TRs were pooled into one master TR7 sample as described above. Seven individual FAs were prepared from TR7 and then pooled into one master FA8 sample (left panel) later diluted to yield on average 68 ± 3 particles per frame. Particles within FA8 sample were analyzed over 12 RRs. Each RR consisted of six 30 s long RM videos captured at fixed CL = 14, SPS = 35, and analyed at DT = 3 NTA settings. RM values were averaged at the end of the run into single final reading value (FRV). Horizontal lines and error bars in the right panel represent the mean and 95% confidence interval of FRVs of uEXO concentration (circle symbols, left Y axis), mean size (square symbols, right Y axis) and modal size (diamond symbols, right Y axis). Relative uncertainty of uEV measurements was expressed as CVRR to assess instrumental intra‐day between‐run precision. Any outlying values detected by Grubbs test at 95% confidence level are indicated by red crossed symbols, and CVRR shown below the scatter plots is computed after outlier elimination.
FIGURE 6
FIGURE 6
Repeatability of selected urinary extracellular vesicle (uEV) protein content measurements by Multi‐Strip Western Blotting (MSWB). (A) The principle of MSWB analysis. Multiple gels were loaded with molecular weight marker (Mr, lanes 1 and 10) and lysates of either individual technical replicate (TR) samples (lanes 3–8) or pooled master TR7 sample in duplicate (lanes 2 and 9) prepared by mixing equal amounts of TR1–TR6 lysates of either uMV or uEXO fractions to resolve proteins by their molecular weight (left panel). After electrophoresis, these gels were cut into strips. Strips that contained the identical antigen of interest, were aligned onto single assembling filter paper, and then transferred onto single nitrocellulose membrane. Following protein transfer, the membrane was blocked and probed with appropriate primary and HRP‐conjugated secondary antibodies. For visualization, some strips were rearranged to alternate between male (M) and female (F) subjects and between uEXO and uMV series, because paired samples were loaded in a randomised manner. Black line strokes around the individual strips were drawn to improve readability. The representative blot shows 50 kDa TSG101 protein level distribution across TR1‐TR7 samples of paired uEV fractions of individual subjects (right panel). (B) Comparison of procedural sample processing precision for selected endogenous uEV protein detection following uEV isolation by DC method. Relative uncertainty of chemiluminescent protein band signal measurements was expressed as CVTR to assess average procedural sample processing precision in six uMV (left panel) or six uEXO (right panel) TR samples obtained from male (teal bars) (N = 3) or female (pink bars) urine (N = 3) by differential velocity centrifugation (DC) method. (C) Comparative uEV‐associated protein marker expression levels before and after elimination of procedural sample processing variations by sample pooling. Average percentage difference calculated between the arithmetic mean of signal detected across six individual TR samples for PKM1/2 (upside triangle symbols), GAPDH (triangle symbols), TSG101 (square symbols) and ALIX (circle symbols) protein bands and an average signal of pooled (TR7) sample, which was loaded in duplicate. The analysis was performed on 8 data points (4 uMV and 4 uEXO series).
FIGURE 7
FIGURE 7
Variance component analysis (VCA) of urinary extracellular vesicle (uEV) hydrodynamic diameter (HD) and polydispersity index (PDI) measurements by dynamic light scattering (DLS). uMV (A) or uEXO (B) particles were isolated from six technical replicates (TRs, k = 6) of single biological source sample by differential velocity centrifugation (DC) method. Each TR was used to prepare three final analyte (FA, l = 3) samples that were measured over three replicate runs (RRs, m = 3) under identical instrumental data capture and analysis conditions. Each RR consisted of ten 30 s long repeated measurements (RMs) that were averaged at the end of the run into single final reading value (FRV). Bars with errors indicate the FRV±SD of three RRs for the HD (left plots, teal bars) or PDI % (right plots, grey bars) measurands in FA1 (upper panel), FA2 (middle panel) or FA3 (bottom panel) sample draw conditions. Pie charts (C) display the estimates of the contribution of different random sources of variation (TR, FA or RR) to the total variance (TV%) of uMV (left panel) and uEXO (right panel) particle HD measurements by DLS. Derivative coefficient of variation percentage (CV%) values for individual variance components are shown inside pie charts. Combined peri‐analytical precision estimate (CVA) is indicated at the bottom of each chart.
FIGURE 8
FIGURE 8
Repeatability of urinary extracellular vesicle (uEV) size measurements by dynamic light scattering (DLS) after removal of procedural sample processing and sample draw variations by sample pooling. (A) Concordance of pooled sample DLS measurement values with the mean of individual technical replicates (TR) for uMV (upper panel) and uEXO (bottom panel) size distribution results. The arithmetic mean of six TRs (black lines) for number‐weighted (NW, solid lines), intensity‐weighted (IW, dashed lines) or volume‐weighted (VW, dotted lines) relative particle frequency (RPF) data was plotted against pooled TR master sample values (grey lines). (B) Repeatability of uEXO measurements by DLS after removal of procedural sample processing variations. Six TRs (k = 6) were pooled into one master TR7 sample, further used to draw seven final analyte (FA) samples (l = 7). The hydrodynamic diameter (HD) (upper panel) and polydispersity index (PDI) (bottom panel) in each FA were measured over three replicated runs (RRs, m = 3). Horizontal lines within RR groups represent the means of FAs. Precision was estimated by a single random factor ANOVA and expressed as CVFA + RR after removal of any outlying values detected by Grubbs test at 95% confidence level (indicated by red crossed symbols). (C) Repeatability of uEV measurements by DLS after removal of both procedural sample processing and sample draw variations. Six TRs of DC‐derived uMV or uEXO fractions were pooled into one master TR7 sample, subsequently used to draw, and then pool seven FAs. Particle HD (upper panel) or PDI (bottom panel) were analyzed over 12 RRs. Each RR consisted of ten 30 s RMs that were averaged at the end of the run into single final reading value (FRV). Horizontal lines and error bars represent the mean and 95% confidence interval of FRVs. Relative uncertainty of uEV measurements was expressed as CVRR to assess instrumental intra‐day between‐run precision. Any outlying values detected by Grubbs test at 95% confidence level are indicated by red crossed symbols, and CVRR shown below the scatter plots is computed after outlier elimination.
FIGURE 9
FIGURE 9
Combined peri‐analytical precision of biophysical urinary extracellular vesicle (uEV) characterisation by SLAM microscopy. Morning urine was obtained from individuals #1 (A) or #2 (B) on three different occasions (Days 1, 2 and 3). Six technical replicates (TRs, k = 6) created per biological source (raw) sample were subjected to differential velocity centrifugation (DC) to isolate urinary microvesicle (uMV) fraction. Resulting primary analyte (PA) was consecutively sampled to prepare five appropriately diluted final analyte (FA) samples (l = 5). Optical redox ratio (ORR) of particles in each FA was measured under identical instrumental data capture and analysis conditions over a minimum of 25 random field of view (FOV) locations. This measurement was considered a single run. The mean of 25 ORR values (white circle symbols) per FA are shown as black shot horizontal lines. The grand mean or grand median of all mean ORR values is shown as teal horizontal solid or dashed lines, respectively. Outlying FA and/or TR values are shown as colored symbols. Derivative CV% values for individual variance components are shown inside the temporal plots. Red values indicate CVA prior to removal of any FA or TR outliers. For variance component analysis (VCA), displayed as pie charts (C), the expected mean square values were estimated by nested random factor ANOVA to find out how much of the total variance (TV%) in typical SLAM results might be attributed to the procedural sample processing (TR‐to‐TR) and sample draw (FA‐to‐FA) differences and how much to random instrumental within‐run error. Combined CVA values for different days are indicated inside pie charts.
FIGURE 10
FIGURE 10
Biological variability of biophysical urinary extracellular vesicle (uEV) characteristics following uEV isolation by differential velocity centrifugation (DC) method. (A) The robustness of short‐term (within‐day) diurnal variations in uEV particle concentration (upper panel) and size (bottom panel). Morning (6–9 AM) or afternoon (12–2 PM) urine was collected five times from the same male (teal symbols) or female (pink symbols) individuals over 1‐month interval. Particle concentration was measured in sequentially isolated microvesicle (uMV, circle symbols) or exosome (uEXO, triangle symbols) fractions by nanoparticle tracking analysis (NTA) technique. (B) The absence of significant diurnal variations in optical redox ratio values of uMV particles. (C) Representative intermediate‐term (between‐day) intra‐individual variations in uEV particle size. Morning urine was collected from the same male individual over 2‐week interval. Intensity‐weighted (IW) uMV (teal lines) and uEXO (magenta lines) particle size distribution was measured by dynamic light scattering (DLS) technique. (D) Representative long‐term (bimonthly) intra‐individual variations in uEV particle counts and size. Morning urine was collected from the same male individual over two year period. Particle concentration (upper panel) and mean number‐weighted size (bottom panel) were co‐measured in sequentially isolated uMV (teal bars) or uEXO (grey bars) fractions by NTA using identical or remarkably close instrumental data acquisition and data analysis settings, including the analyte concentration range. Errors indicate SD of six technical replicate measurements per biological sample. Numbers above bars indicate the uEXO:uMV or uMV:uEXO ratio for particle concentration (expressed as particles/mL raw urine) or mean size (in nm) measurands, respectively. (E) Intra‐individual variability of uEV particle concentration, size and metabolic activity. First morning urine collected from different mixed gender individuals (N = 7) at least three independent times was used to measure within‐subject coefficient of variation (CVI) in uEV particle counts (left panel), mean size (middle panel) and ORR (right panel). The horizontal teal line represents the median of data group. (F) Inter‐individual variability of uEV particle concentration, size and metabolic activity. First morning urine collected from different mixed gender individuals (N = 17) was used to isolate uEVs by the DC method. Concentration (left panel), mean size (middle panel) and ORR (right panel) of indicated uEV fraction particles were measured by either NTA or SLAM microscopy techniques. The horizontal teal line represents the median of data group. The degree of between‐subject variations is expressed as CVG percentage.

Similar articles

References

    1. Aksamitiene, E. , Hoek J. B., Kholodenko B., and Kiyatkin A.. 2007. “Multistrip Western Blotting to Increase Quantitative Data Output.” Electrophoresis 28, no. 18: 3163–3173. - PMC - PubMed
    1. Alhallak, K. , Rebello L. G., Muldoon T. J., Quinn K. P., and Rajaram N.. 2016. “Optical Redox Ratio Identifies Metastatic Potential‐Dependent Changes in Breast Cancer Cell Metabolism.” Biomedical Optics Express 7, no. 11: 4364–4374. - PMC - PubMed
    1. Analytical Methods Committee Amctb N . 2015. “An Analyst's Guide to Precision.” Analytical Methods 7, no. 20: 8508–8510. - PubMed
    1. Bachurski, D. , Schuldner M., Nguyen P. H., et al. 2019. “Extracellular Vesicle Measurements With Nanoparticle Tracking Analysis—An Accuracy and Repeatability Comparison Between NanoSight NS300 and ZetaView.” Journal of Extracellular Vesicles 8, no. 1: 1596016. - PMC - PubMed
    1. Benedikter, B. J. , Bouwman F. G., Vajen T., et al. 2017. “Ultrafiltration Combined With Size Exclusion Chromatography Efficiently Isolates Extracellular Vesicles From Cell Culture Media for Compositional and Functional Studies.” Scientific Reports 7, no. 1: 15297. - PMC - PubMed

LinkOut - more resources