. 2025 Jul;21(26):e2409392.
doi: 10.1002/smll.202409392. Epub 2025 May 19.

Formation of a β-Endorphin Corona Mitigates Alzheimer's Amyloidogenesis

Affiliations

Formation of a β-Endorphin Corona Mitigates Alzheimer's Amyloidogenesis

Yunxiang Sun et al. Small. 2025 Jul.

Abstract

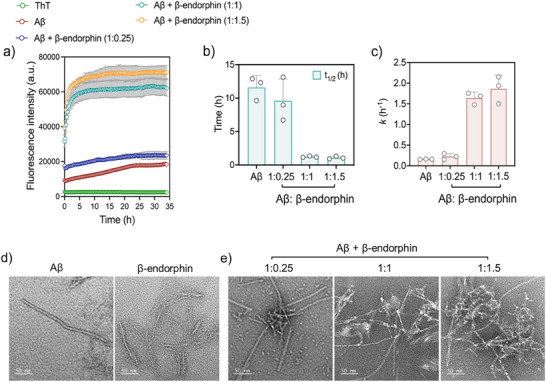
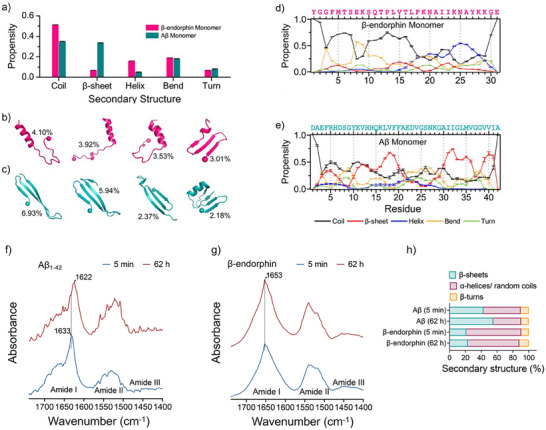
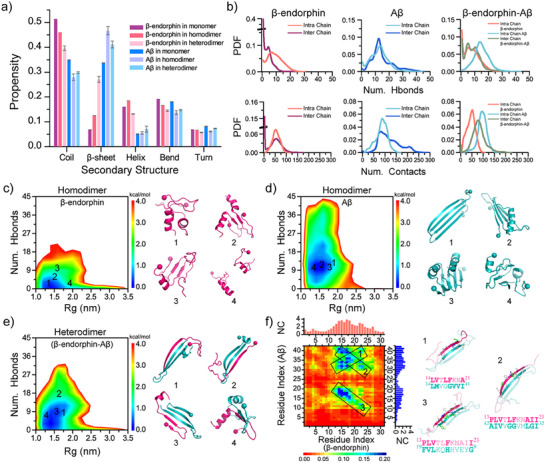
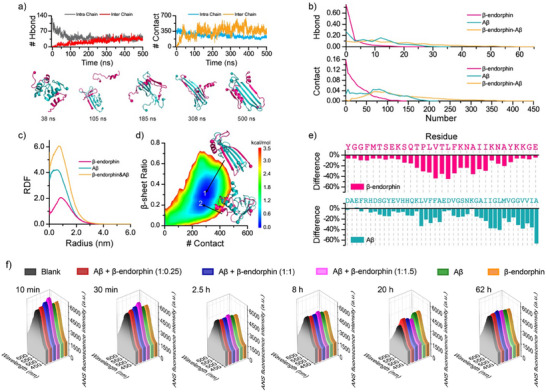
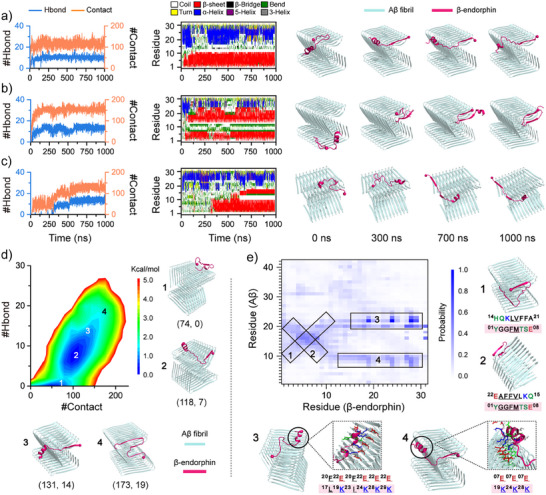
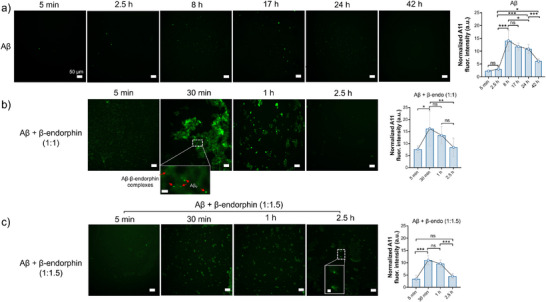
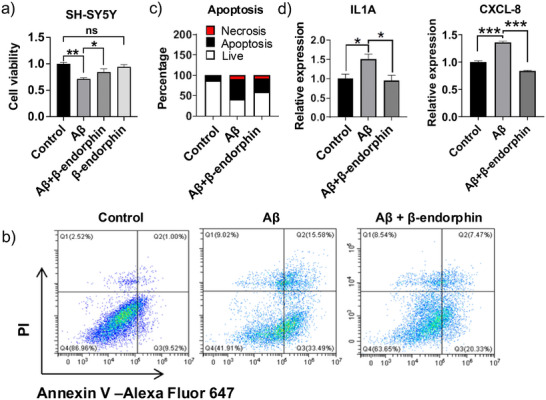
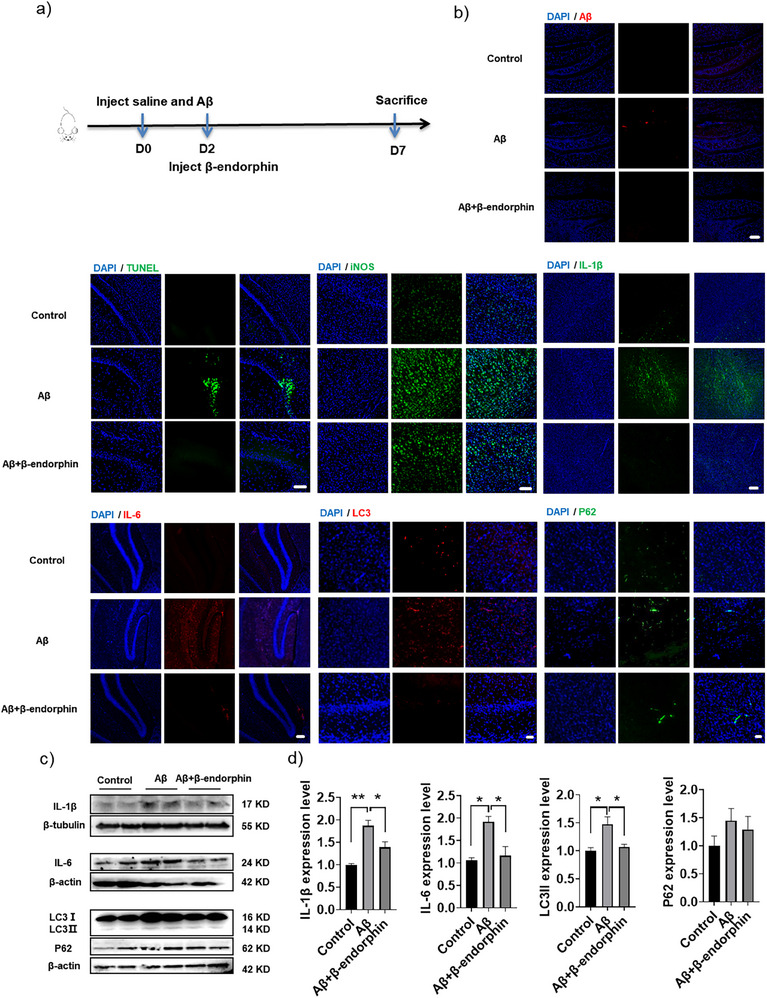
Senile plaques, comprised of nanosized aggregates of amyloid-β (Aβ) peptides in the brain, are a pathological hallmark of Alzheimer's disease (AD). On the other hand, regular physical exercise is known to significantly reduce the risk of developing AD. Here, it is reported on the transformation and toxicity mitigation of Aβ amyloid aggregation by a spontaneous "corona" of β-endorphin, a major peptide hormone released upon exercise to suppress post-exercise pain. Given that both Aβ and β-endorphin co-localize extracellularly in the brain, it is postulated that β-endorphin may mitigate the toxicity of Aβ aggregation via direct molecular interactions, thereby contributing to an exercise-mediated reduction of AD risk. Combining biophysical characterizations in vitro with atomistic discrete molecular dynamics simulations in silico, a strong interaction is shown between β-endorphin and Aβ, where β-endorphins are located at the periphery to render a corona of their hetero-complexes with Aβ. Cell viability, immunofluorescence and western blotting assays further revealed that the corona shielded cellular exposure to Aβ aggregates and suppressed the toxicity of Aβ in vivo. This work offered a new molecular mechanism for the benefits of physical exercise, which may facilitate a rational design of future therapy and prevention strategies against AD and dementia.

Keywords: Alzheimer's disease; Aβ aggregation; corona; discrete molecular dynamics; β‐endorphin.


Conflict of interest statement

The authors declare no conflict of interest.

Figures

Figure 1
Figure 1
In vitro investigation of the interaction between β‐endorphin and Aβ42 in aqueous solutions of neutral pH. a) Aβ42 (20 µM) aggregation accelerated by β‐endorphin (5–30 µM of applied concentration) probed by a ThT (100 µM) assay. Each data point represents the mean value of triplicate measurements (n = 3) ± standard errors of the mean (SEM). b‐c) Aggregation kinetic parameters (t1/2 and apparent aggregation constant k) of Aβ42 (20 µM) over time in the presence and absence of β‐endorphin (5, 20, and 30 µm), extracted from the corresponding sigmoidal curves represented in panel a. d) Morphologies of Aβ42 and β‐endorphin imaged with TEM upon 62 h incubation at 37 °C at pH 7. The highest applied concentrations of both proteins (Aβ42: 20 µM‐scale bar: 50 nm, β‐endorphin: 30 µM‐scale bar: 50 nm) were used for imaging. e) TEM imaging of Aβ42 (20 µM) co‐incubated with β‐endorphin at the molar ratios of 1:0.25‐1.5 upon 62 h of incubation at 37 °C and pH 7. Scale bars: 50 nm.
Figure 2
Figure 2
Secondary structure analysis of monomeric β‐endorphin and Aβ42. Average secondary structure content of monomeric β‐endorphin and Aβ42. a) Representative structures of top four most populated conformational clusters of β‐endorphin and b) Aβ42. c) Propensity of each residue adopting different types of secondary structures for β‐endorphin and d) Aβ42. e) For each peptide, fifty independent DMD simulations were performed with simulation times lasting 500 ns[2] for each trajectory. The simulation equilibrium was achieved as illustrated by the time‐evolution of secondary structures in the SI. Only the last 200 ns equilibrium simulation data were used for clustering and secondary structure analysis. f‐g) Amide I, II and III band spectra (n = 1) (1740‐1400 cm−1, 512 scans, 4 cm−1 resolution) of Aβ42 (20 µM) (f) and β‐endorphin (30 µM) (g) acquired through ATR‐FTIR spectroscopy upon 5 min and 62 h of incubation at 37 °C. h) Quantitative secondary structure (%) profiles (β‐sheets: aqua green, α‐helices/random coils: lilac, β‐turns: orange) were obtained from the respective amide I bands (n = 1) (1690–1605 cm−1) presented in Figure S4 (Supporting Information) upon deconvolution through an OriginLab built‐in peak deconvolution tool.
Figure 3
Figure 3
Conformal analysis for the homodimers and hetero‐dimers of β‐endorphin and Aβ42. a) Secondary structure contents of β‐endorphin and Aβ42 in the monomer, homodimer, and heterodimer simulations. b) Probability distribution functions (PDFs) of intra‐chain and inter‐chain hydrogen bonds (upper) and residue‐pairwise contacts (lower) in two homodimer (β‐endorphin, Aβ42) and one heterodimer (β‐endorphin‐Aβ42) simulations. c‐e) 2D conformational free‐energy landscape as a function of radius of gyration (Rg) and number of inter‐molecular hydrogen bonds for each of homo and hetero‐dimer systems. f) Inter‐molecular residue‐pairwise contact map between β‐endorphin and Aβ42. Three representative inter‐molecular β‐sheet contact motifs corresponding to the two boxed patterns in the contact map are illustrated to the right, where the K19 residues of β‐endorphin are highlighted in blue.
Figure 4
Figure 4
Formation of hetero‐tetramers in DMD simulations and validated by a 8‐anilino‐1‐naphthalenesulfonic acid (ANS) measurement. a) Time evolution of the numbers of intra‐ and inter‐molecular hydrogen bonds as well as contacts in the aggregation simulations of two β‐endorphin and two Aβ peptides. b) Probability distributions of the inter‐molecular hydrogen bonds and contacts during the last 100 ns of 50 independent DMD simulations. c) Radial distribution function (RDF) of Cα atoms from β‐endorphin and Aβ42 in the hetero‐tetramer. d) Conformational free‐energy landscape of the hetero‐tetramer complexes. e) Ratios of changes of accessible surface area per residue for both β‐endorphin and Aβ42 in the hetero‐tetramer simulations as compared to that in their corresponding homo‐dimer simulations. f) Experimentally measured ANS fluorescence spectra (n = 1) (λex: 375 nm, λem: 425–625 nm) revealed existence of hydrophobic binding between β‐endorphin and Aβ42 in a range of molar ratios (1:0.25‐1.5) over time (10 min–62 h).
Figure 5
Figure 5
Binding dynamics and conformational analysis for the β‐endorphin binding to the surface of an Aβ fibril. Time evolution of the number of intermolecular contacts and main‐chain hydrogen bonds between β‐endorphin and Aβ fibril (left panel), secondary structure of each residue from β‐endorphin (middle panel), and corresponding snapshots (right panel) at 0, 300, 700, and 1000 ns. a–c) Three trajectories were randomly selected from 50 independent trajectories. The binding free‐energy landscape as a function of the number of intermolecular contacts and main‐chain hydrogen bonds is also constructed based on 50 independent 1000 ns trajectories to comprehensively capture the binding process. d) Four snapshots corresponding to the binding of β‐endorphin to the lateral, elongation, and both lateral mixing with elongation surfaces of the Aβ fibril, labeled 1–4 on the free energy landscape. The residue‐pairwise contact frequency between β‐endorphin and Aβ fibril along with the representative binding motifs with a strong contact tendency are shown. e) Only the last 400 ns of saturated simulation data from each 1000 ns independent trajectory was used for the residue‐pairwise contact analysis. For clarity, Aβ and β‐endorphin are colored cyan and pink, respectively.
Figure 6
Figure 6
In vitro oligomeric (A11) immunofluorescence assay revealed evolution of the oligomeric population and indicated the formation of a β‐endorphin corona encircling an inner core of Aβ aggregates. a) A11 immunofluorescence of Aβ42 (20 µm) at 37 °C for tracking oligomeric species at different timepoints (5 min‐42 h). Scale bars: 50 µm. Normalized green‐channel fluorescence quantification of A11‐stained oligomers exhibited a characteristic fluorescence histogram over time. b,c) A11 immunofluorescence of Aβ42 co‐incubated with β‐endorphin at 1:1 and 1:1.5 molar ratios exhibited a characteristic acceleration of Aβ42 aggregation resulting in the formation of larger amorphous aggregates, while decreasing the durations of oligomeric populations. Scale bars: 50 µm, Inner panel scale bars: 10 µm. Normalized green‐channel fluorescence quantification of A11‐stained β‐endorphin‐Aβ42 oligomer complexes exhibiting a characteristic fluorescence histogram over time. Image analysis was performed with ImageJ/Fiji software. Fluorescence intensity values were measured by integrating the intensity of the Z‐projected images (n = 4 per sample group, performed in duplicate) and subsequent background subtraction. Each data point represents the mean values of quantified fluorescence from four images in duplicate (n = 8) ± standard errors of the mean (SEM). Statistical significance was calculated through one‐way ANOVA tests followed by Tukey's post‐hoc test for multiple comparisons (ns, > 0.05, *, < 0.05, **, < 0.01, and ***, < 0.001). Statistical analysis was performed through GraphPad Prism.
Figure 7
Figure 7
β‐endorphin reduced Aβ‐induced adverse effects in SH‐SY5Y human neuroblastoma cells. Aβ monomers were dissolved in 5 µL 0.1% NH4OH buffer and further diluted in deionized water to obtain a 200 µm solution, then was incubated at 37 °C for 3 h. SH‐SY5Y cells were exposed to Aβ (20 µm) with or without β‐endorphin (20 µm) for 20 h. a) Cell viability was detected by a cell counting kit (CCK‐8) assay, indicating a notable improvement of Aβ‐induced cytotoxicity with the introduction of β‐endorphin. b,c) Cell apoptosis was assessed by flow cytometry (b) and analyzed (c). Apoptotic cells were labeled with Annexin V (Alexa Fluor 647), and necrotic cells were labeled with propidium iodide (PI) (Q1: necrosis. Q2: late apoptosis. Q3: early apoptosis. Q4: normal cells). d) mRNA expressions of IL‐1α and IL‐8 were examined by qPCR. GAPDH was used as a housekeeping gene and the relative gene expression was normalized to the control group. Data = mean ± SEM (n = 3) (a, d), ns, > 0.05, *, < 0.05, **, < 0.01, and ***, < 0.001. Statistical significance was calculated by two‐tailed Student's t‐test (a, d).
Figure 8
Figure 8
β‐endorphin alleviated Aβ‐induced brain impairments in Aβ‐injected mice in vivo. a) Treatment strategy of Aβ and β‐endorphin into mouse hippocampus in vivo; D, day. b) Representative images of the immunoactivity of A11 oligomers, apoptosis, the expression of iNOS, IL‐1β, IL‐6, LC3B, and P62 in the hippocampal region of the brains in saline‐injected mice, Aβ‐injected mice, Aβ‐injected mice treated with β‐endorphin. Scale bars: 100 µm. c,d) Western blot detection of IL‐1β, IL‐6, P62, LC3 expressions in the hippocampus of saline‐injected mice, Aβ‐injected mice, and Aβ‐injected mice treated with β‐endorphin. The gray values of specific protein bands were normalized to the corresponding β‐actin and β‐tubulin bands, the relative expression level of each sample was calculated and the quantitative data were presented as mean ± SEM (n = 3), *, < 0.05, **, < 0.01. Statistical significance was calculated by two‐tailed Student's t‐test through GraphPad Prism (d).

Similar articles

References

    1. Nasica‐Labouze J., Nguyen P. H., Sterpone F., Berthoumieu O., Buchete N. V., Cote S., De Simone A., Doig A. J., Faller P., Garcia A., Laio A., Li M. S., Melchionna S., Mousseau N., Mu Y., Paravastu A., Pasquali S., Rosenman D. J., Strodel B., Tarus B., Viles J. H., Zhang T., Wang C., Derreumaux P., Chem. Rev. 2015, 115, 3518. - PMC - PubMed
    1. Sun Y., Kakinen A., Wan X., Moriarty N., Hunt C. P. J., Li Y., Andrikopoulos N., Nandakumar A., Davis T. P., Parish C. L., Song Y., Ke P. C., Ding F., Nano Today 2021, 38, 101125. - PMC - PubMed
    1. Lu J. X., Qiang W., Yau W. M., Schwieters C. D., Meredith S. C., Tycko R., Cell 2013, 154, 1257. - PMC - PubMed
    1. Iadanza M. G., Jackson M. P., Hewitt E. W., Ranson N. A., Radford S. E., Nat. Rev. Mol. Cell Biol. 2018, 19, 755. - PMC - PubMed
    1. Ke P. C., Sani M. A., Ding F., Kakinen A., Javed I., Separovic F., Davis T. P., Mezzenga R., Chem. Soc. Rev. 2017, 46, 6492. - PMC - PubMed

LinkOut - more resources