Regional retinal vulnerability in multiple sclerosis: integrating OCT, MRI, and clinical data for enhanced diagnosis and automated monitoring
- PMID: 40384198
- PMCID: PMC12236293
- DOI: 10.47162/RJME.66.1.11
Regional retinal vulnerability in multiple sclerosis: integrating OCT, MRI, and clinical data for enhanced diagnosis and automated monitoring
Abstract
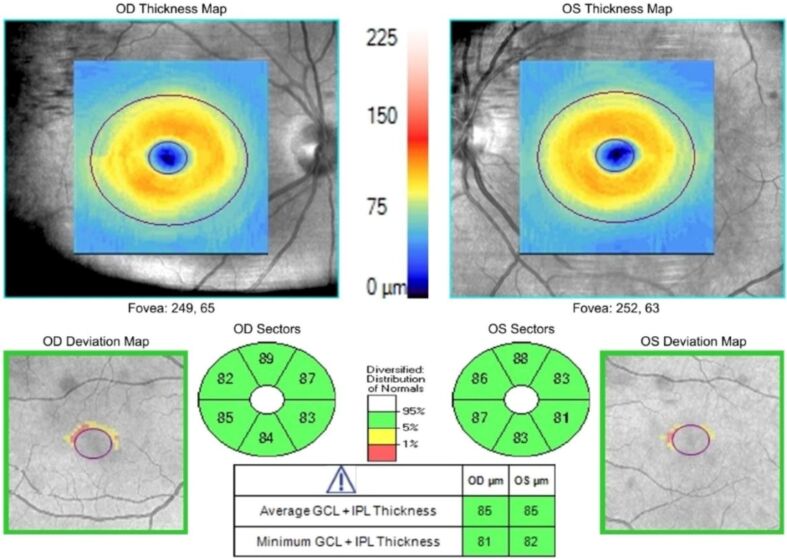
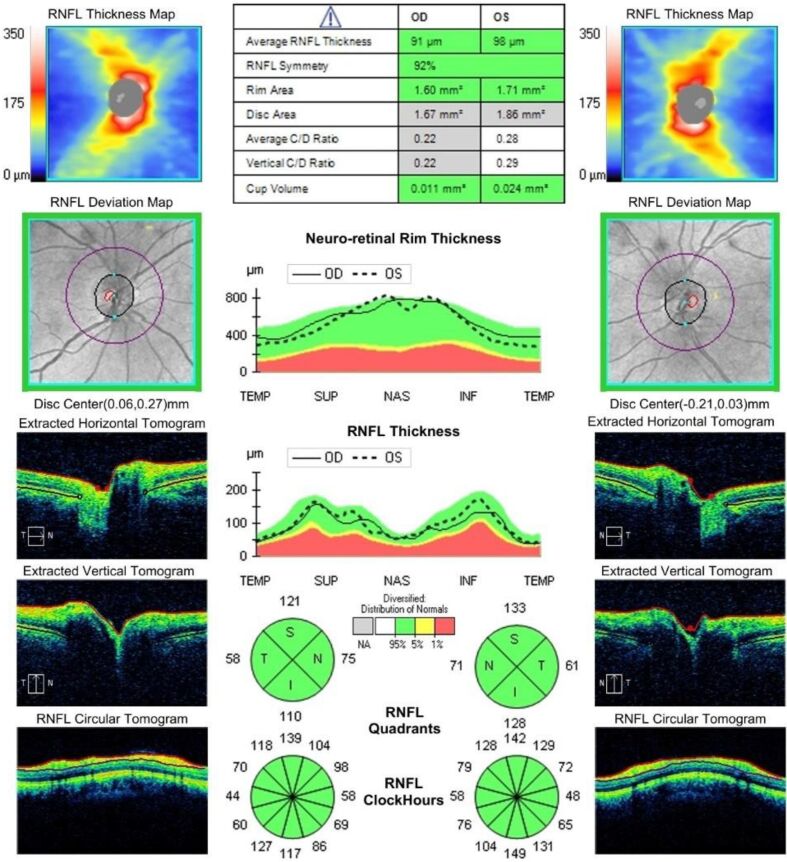
Multiple sclerosis (MS) is a chronic autoimmune disease of the central nervous system, often affecting the visual pathways. Optical coherence tomography (OCT) has emerged as a valuable, non-invasive imaging tool for assessing neuroaxonal damage in MS. This study investigates retinal neurodegeneration in MS patients, focusing on ganglion cell layer and inner plexiform layer (GCL+IPL) thinning, macular volume (MV), and retinal nerve fiber layer (RNFL) alterations, and their correlation with clinical and magnetic resonance imaging (MRI) parameters. A total of 43 MS patients and 38 healthy controls underwent three OCT investigations over three years, measuring GCL+IPL thickness, MV, and RNFL parameters. Clinical disability was assessed using the Expanded Disability Status Scale (EDSS), and MRI data were available, with parameters such as lesion volume, whole brain volume, and white matter percentage analyzed. Statistical comparisons included t-tests, analysis of variance (ANOVA), and Pearson's correlation to evaluate OCT changes and their associations with clinical and MRI findings. MS patients exhibited significant GCL+IPL thinning, with quadrant analysis revealing regional disparities. Macular thickness showed no significant global differences; however, outer quadrant thinning was observed. RNFL analysis confirmed significant temporal quadrant thinning, further supporting its selective vulnerability in MS. Over three years, no significant longitudinal changes were detected in any OCT parameters (p>0.05). MRI lesion volume correlated strongly with EDSS (Pearson, r=0.61) and moderately with GCL+IPL thickness (Pearson, r=0.42), while a weaker correlation was found with temporal RNFL thickness. These findings reinforce OCT as an essential biomarker for MS-related neurodegeneration, particularly through GCL+IPL and temporal RNFL thinning. While macular changes were minimal, the observed selective temporal quadrant vulnerability aligns with previous research linking retinal alterations to trans-synaptic degeneration and optic radiation damage. The lack of significant longitudinal OCT progression over three years suggests that retinal atrophy may require longer monitoring periods to detect meaningful disease progression or to enable automated diagnosis. OCT is a reliable tool for detecting subclinical neurodegeneration in MS, particularly through temporal RNFL and GCL+IPL thinning. The moderate correlation between MRI lesion volume and retinal changes supports the integration of OCT with MRI for multimodal disease monitoring. The application of artificial intelligence (AI)-driven OCT analysis holds promise for enhanced MS diagnosis and automated progression monitoring. Future research should focus on long-term longitudinal studies, AI-assisted OCT diagnostics, and multimodal imaging approaches to optimize personalized MS management.
Keywords: MRI; OCT; automated diagnosis; multiple sclerosis; regional retinal vulnerability.
Conflict of interest statement
The authors declare that they have no conflict of interests.
Figures
References
-
- Sergott RC, Frohman E, Glanzman R, Al-Sabbagh A; The role of optical coherence tomography in multiple sclerosis: expert panel consensus. J Neurol Sci. 2007;263(1-2):3–14. - PubMed
-
- Schippling S, Balk LJ, Costello F, Albrecht P, Balcer L, Calabresi PA, Frederiksen JL, Frohman E, Green AJ, Klistorner A, Outteryck O, Paul F, Plant GT, Traber G, Vermersch P, Villoslada P, Wolf S, Petzold A. Quality control for retinal OCT in multiple sclerosis: validation of the OSCAR-IB criteria. Mult Scler. 2015;21(2):163–170. - PubMed
-
- Petzold A, de Boer, Schippling S, Vermersch P, Kardon R, Green A, Calabresi PA, Polman C. Optical coherence tomography in multiple sclerosis: a systematic review and meta-analysis. Lancet Neurol. 2010;9(9):921–932. - PubMed
MeSH terms
LinkOut - more resources
Full Text Sources
Medical