. 2025 Dec;47(1):2502875.
doi: 10.1080/0886022X.2025.2502875. Epub 2025 May 19.

Shen Shuai II Recipe alleviates renal fibrosis in chronic kidney disease by improving of hypoxia and inhibition of TLR4/MyD88/NF-κB/NLRP3 pathway

Affiliations

Shen Shuai II Recipe alleviates renal fibrosis in chronic kidney disease by improving of hypoxia and inhibition of TLR4/MyD88/NF-κB/NLRP3 pathway

Yuan Zhou et al. Ren Fail. 2025 Dec.

Abstract

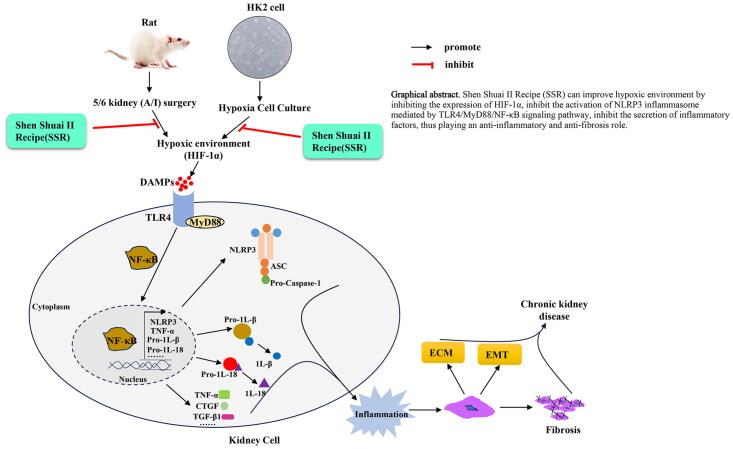
Objectives: To investigate the anti-fibrotic mechanisms of Shen Shuai II Recipe (SSR) in chronic kidney disease (CKD), focusing on its modulation of hypoxia-associated inflammatory pathways and the TLR4/MyD88/NF-κB/NLRP3 axis.

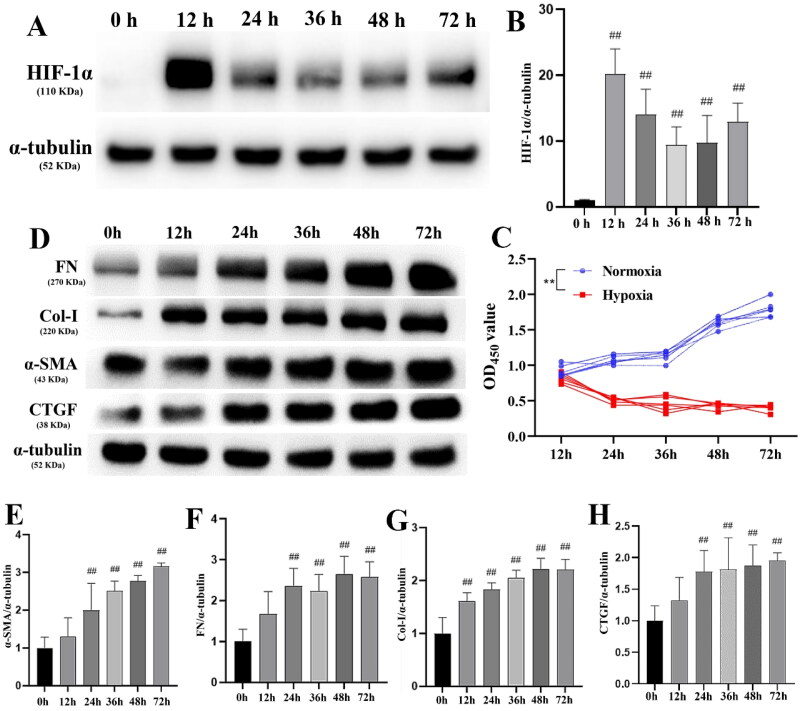
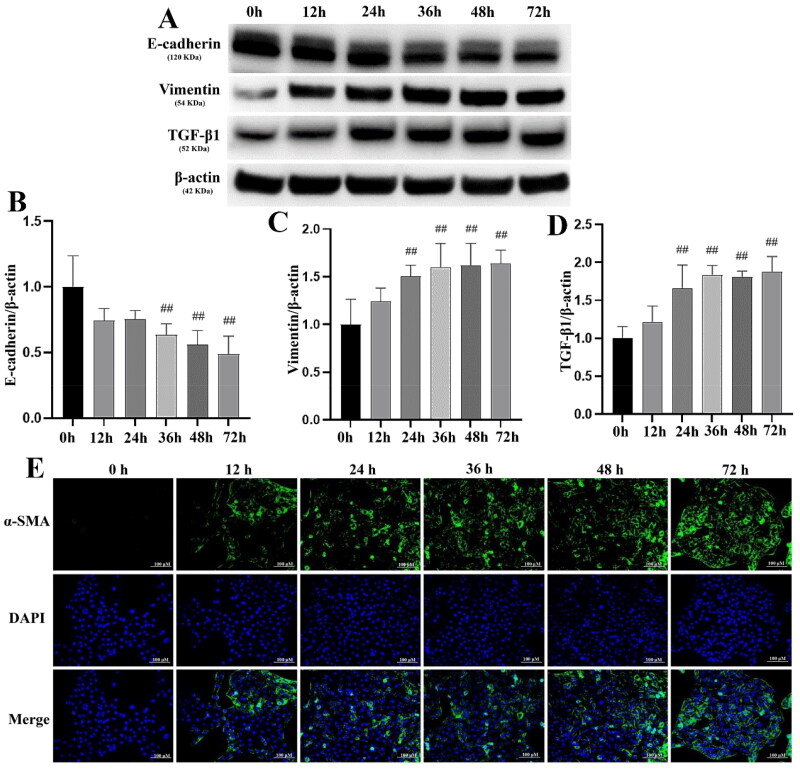
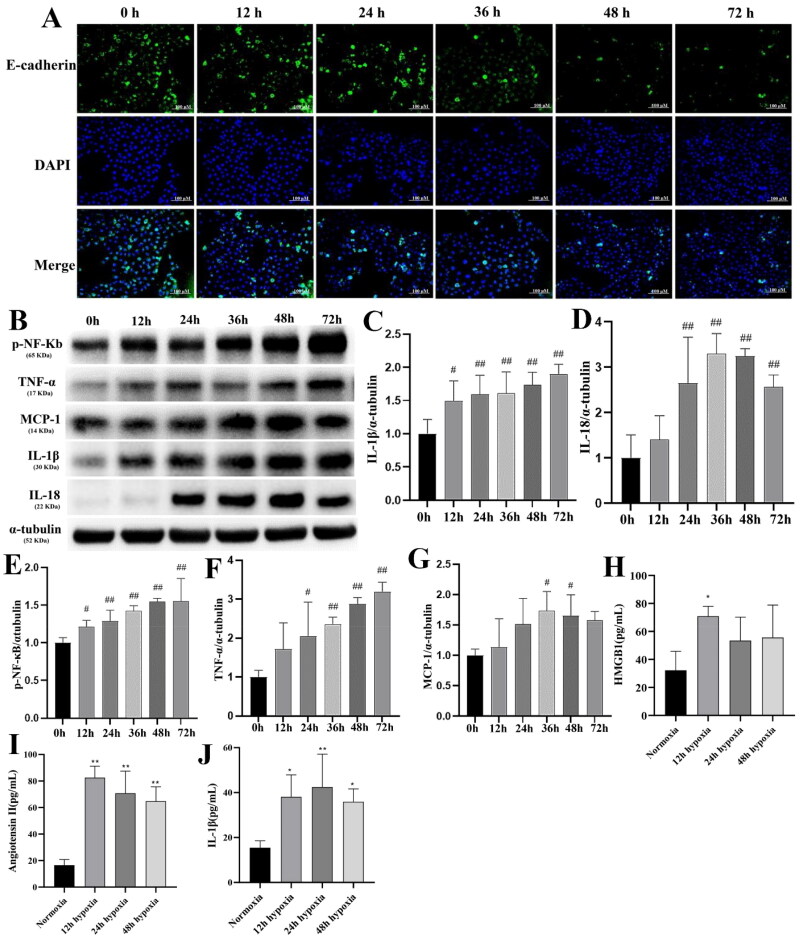
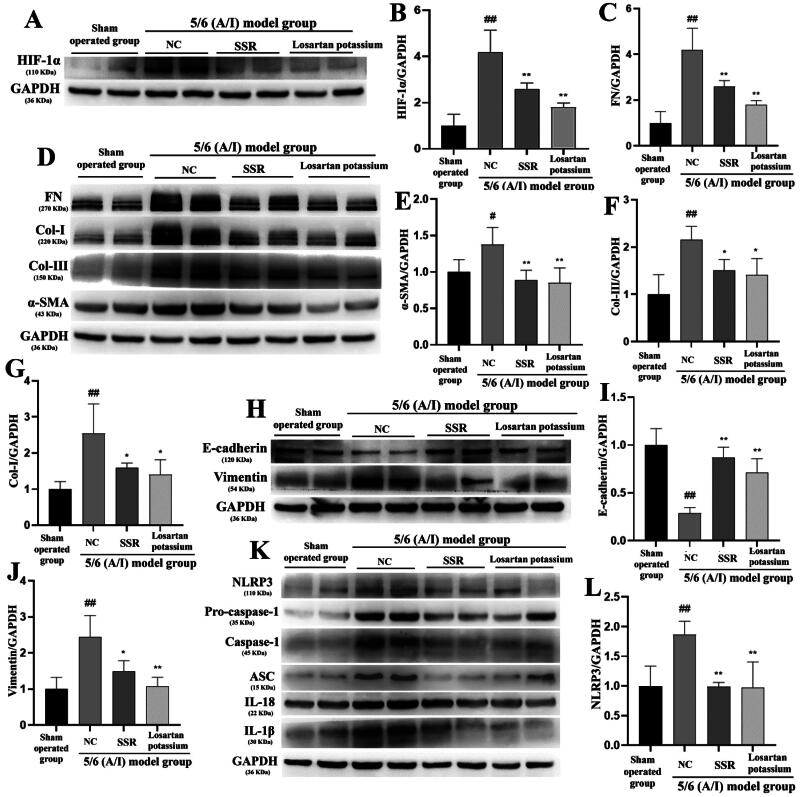
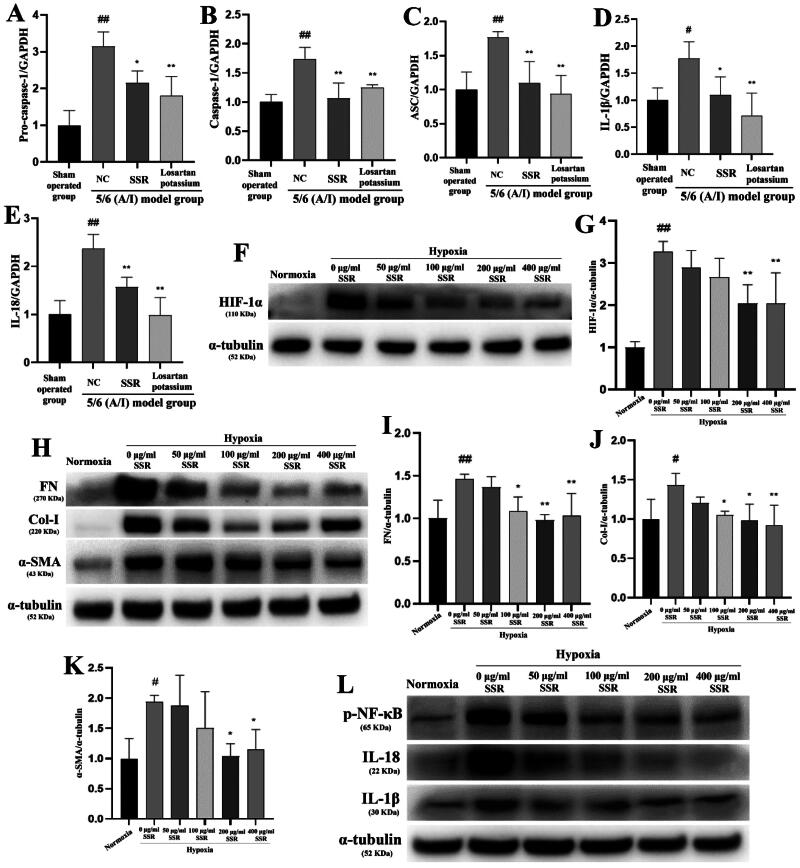
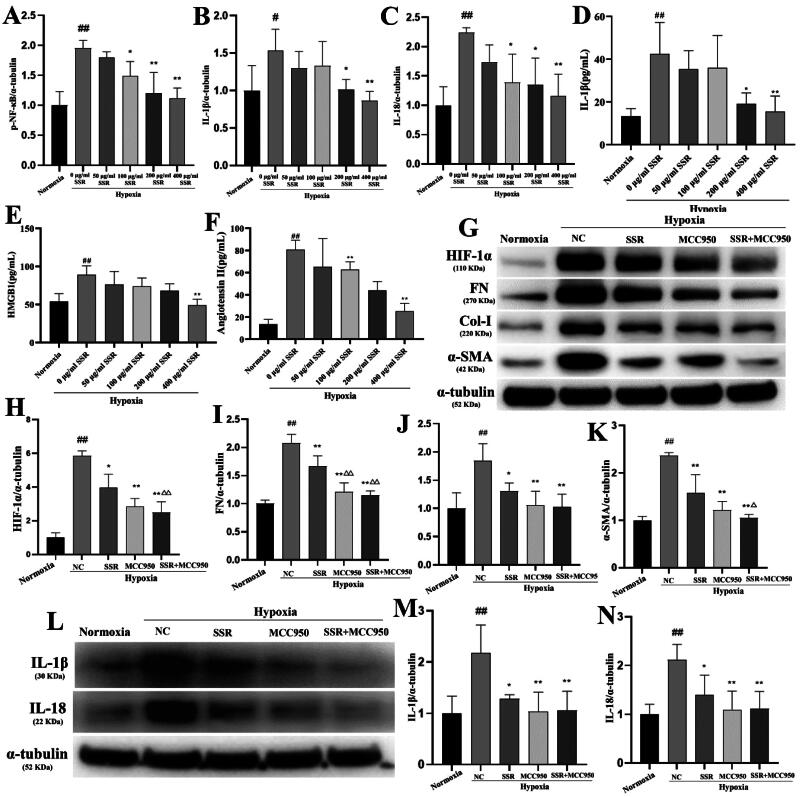
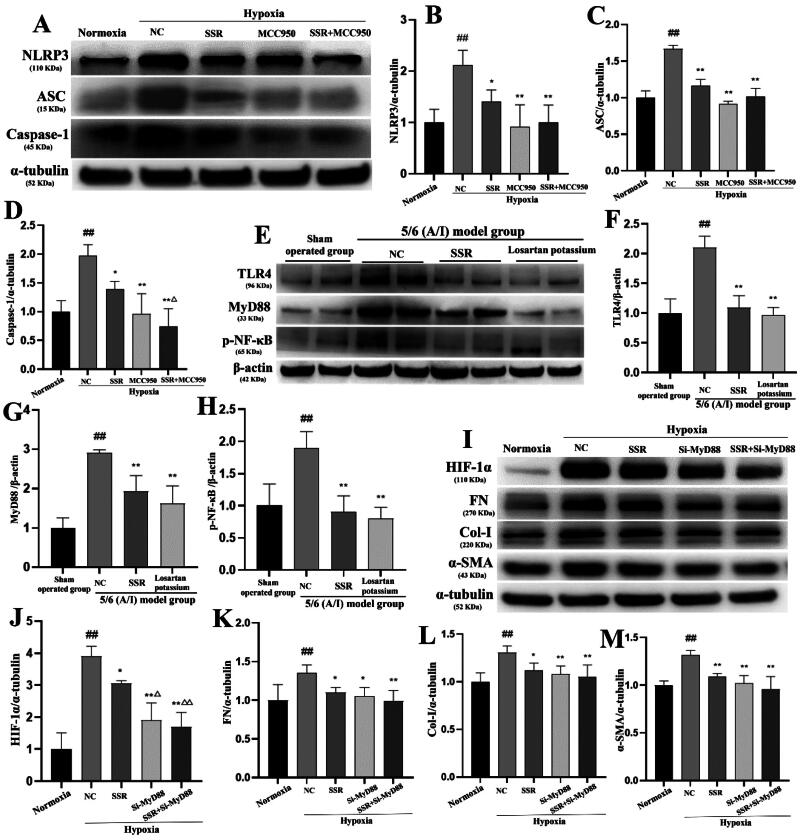
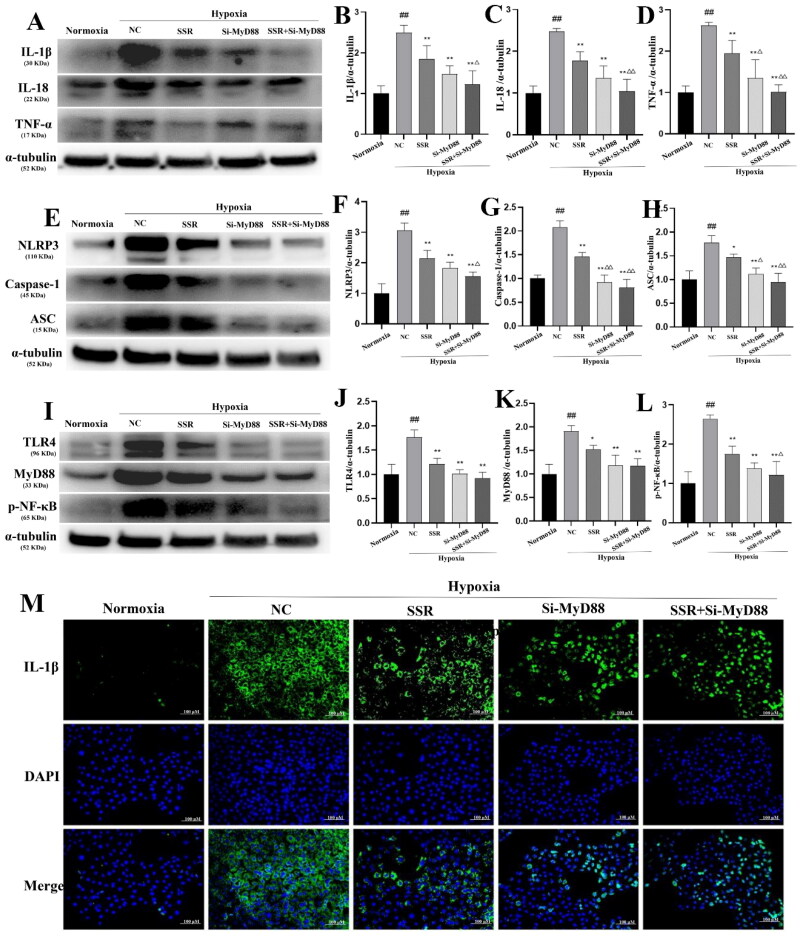
Methods: A 5/6 nephrectomy-induced chronic renal failure (CRF) rat model and hypoxia-exposed human renal tubular epithelial (HK-2) cells were utilized. In vivo, renal function was assessed via serum creatinine, urea nitrogen, and creatinine clearance measurements, alongside histopathological evaluation of renal fibrosis and inflammation. In vitro, hypoxia-treated HK-2 cells were analyzed for fibrotic markers (fibronectin, collagen I, α-smooth muscle actin) and pro-inflammatory cytokines (IL-1β, IL-18). Molecular mechanisms were probed through protein expression analysis of HIF-1α and the TLR4/MyD88/NF-κB pathway, with NLRP3 inflammasome activity evaluated.

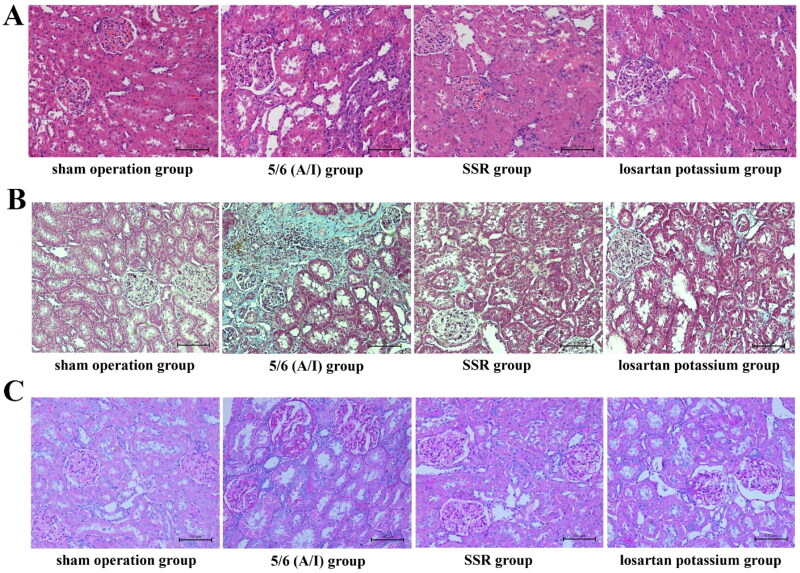
Results: SSR treatment significantly improved renal function in CRF rats, reducing serum creatinine (Scr) and urea nitrogen (BUN) while enhancing creatinine clearance. Histopathology revealed preserved renal architecture with attenuated fibrosis and inflammatory infiltration. In hypoxic HK-2 cells, SSR downregulated fibrotic markers and suppressed IL-1β and IL-18 levels. Mechanistically, SSR reduced HIF-1α expression, inhibited TLR4/MyD88/NF-κB signaling, and suppressed NLRP3 inflammasome activation in both models.

Conclusions: SSR alleviates renal fibrosis and CKD progression by mitigating hypoxia-driven inflammation and blocking the TLR4/MyD88/NF-κB/NLRP3 pathway.

Keywords: Shen Shuai II Recipe (SSR); TLR4/MyD88/NF-κB; hypoxia; inflammation; renal interstitial fibrosis.


Conflict of interest statement

No potential conflict of interest was reported by the author(s).

Figures

None
Graphical abstract
Figure 1.
Figure 1.
Histopathological evaluation of renal tissue in 5/6(a/I) rats treated with Shen Shuai II Recipe (SSR). (A) Comparison of hematoxylin-eosin (HE) staining results in renal tissue of rats in each group (×200). Sham-operated controls show intact glomerular architecture, while 5/6(a/I) rats exhibit structural disorganization, Bowman’s capsule adhesions and interstitial inflammation. SSR-treated groups demonstrate preserved glomerular morphology and reduced inflammatory infiltration. (B) Masson’s trichrome staining (×200) illustrating collagen deposition (blue) in renal interstitium. The 5/6(a/I) model displays extensive fibrosis, whereas SSR intervention attenuates collagen accumulation. (C) PAS staining (×200) reveals glomerular basement membrane integrity. Pathological features (thickened membranes, capillary collapse) in 5/6(a/I) rats are mitigated by SSR treatment. 5/6(a/I): 5/6 ablation and infarction.
Figure 2.
Figure 2.
Hypoxia-induced fibrotic responses in HK-2 cells. (A,B) Western blot results of the effect of HIF-1α protein expression in hypoxia HK-2 cells. #: Compared with the 0 h group, ##p < .01. Protein bands: HIF-1α (1:2000, 110 KDa), α-tubulin (1:2000, 52 KDa). (C) CCK8 assay revealed progressive hypoxia-induced suppression of HK-2 cell viability. ** p < .01. (D) to (H) Western blot results of the effect of FN, Col-I, CTGF and α-SMA protein expression in hypoxia HK-2 cells. #: Compared with the 0 h group, ##p < .01. Protein bands: FN (1:2000, 270 KDa), Col-I (1:2000, 220KDa), α-SMA (1:1000, 43 KDa), CTGF (1:1000, 38 KDa), α-tubulin(1:2000, 52 KDa).
Figure 3.
Figure 3.
Hypoxia induces epithelial-mesenchymal transition (EMT) and fibrotic activation in HK-2 cells. (A) to (D) Western blot results of the effect of E-cadherin, vimentin, and TGF-β1 protein expression in hypoxia HK-2 cells. #: Compared with the 0 h group, ##p < .01. Protein bands: E-cadherin (1:1000, 120 KDa), vimentin (1:1000, 54 KDa), TGF-β1 (1:2000, 52 KDa), β-actin (1:2000, 42 KDa). (E) Immunofluorescence staining of α-SMA (green) and DAPI (blue) in HK-2 cells under hypoxia. Scale bar: 100 μm.
Figure 4.
Figure 4.
Hypoxia-induced inflammatory activation in HK-2 cells. (A) Immunofluorescence staining of E-cadherin (green) and DAPI (blue) in HK-2 cells under hypoxia. Scale bar: 100 μm. (B) to (G) Western blot results of the effect of inflammatory factor protein expression in hypoxia HK-2 cells. #: Compared with the 0 h group, #p < .05, ##p < .01. Protein bands: P-NF-κB (1:1000, 65 KDa), TNF-α (1:1000, 17 KDa), MCP1 (1:1000, 14 KDa), IL-1β (1:1000, 30 KDa), IL-18 (1:1000, 22 KDa), α-tubulin(1:2000, 52 KDa). (H) The levels of HMGB1 in the culture medium of hypoxia HK-2 cells. *p < .05. (I) The levels of Ang-II in the culture medium of hypoxia HK-2 cells. **p < .01. (J) The levels of IL-1β in the culture medium of hypoxia HK-2 cells. *p < .05, **p < .01.
Figure 5.
Figure 5.
Shen Shuai II Recipe (SSR) attenuates hypoxia-driven fibrosis and NLRP3 inflammasome activation in 5/6 (A/I) rats. (A,B) Western blot results of the effect of SSR on the expression of HIF-1α in 5/6 (A/I) rats. #Compared with the sham-operated group, ##p < .01.*: Compared with the NC group, **p < .01. Protein bands: HIF-1α (1:2000, 110 KDa), GAPDH (1:2000, 36 KDa). (C) to (G) Western blot results of the effect of SSR on the expression of FN, Col-III, Col-I, and α-SMA in 5/6 (A/I) rats. #: Compared with the sham-operated group, #p < .05, ##p < .01.*: Compared with the NC group, *p < .05, **p < .01. Protein bands: FN (1:2000, 270 KDa), Col-I (1:2000, 220 KDa), α-SMA (1:1000, 43 KDa), Col-III (1:500, 150 KDa), GAPDH (1:2000, 36 KDa). (H) to (J) Western blot results of the effect of SSR on the expression of E-cadherin and vimentin in 5/6 (A/I) rats. #: Compared with the sham-operated group, ##p < .01.*: Compared with the NC group, *p < .05, **p < .01. Protein bands: E-cadherin (1:1000, 120KDa), vimentin (1:1000, 54 KDa), GAPDH (1:2000, 36 KDa). (K) and (L) Western blot results of the effect of SSR on the expression of NLRP3, pro-caspase-1, caspase-1, ASC, IL-1β, and IL-18 in 5/6 (A/I) rats. #: Compared with the sham-operated group, ##p < .01.*: Compared with the NC group, **p < .01. 5/6(a/I): 5/6 ablation and infarction.NC: negative control. Protein bands: NLRP3 (1:1000, 110 KDa), pro-caspase-1 (1:2000, 35 KDa), caspase-1 (1:2000, 45 KDa), ASC (1:1000,15KDa), IL-1β (1:1000, 30KDa), IL-18 (1:1000, 22KDa), GAPDH (1:2000,36KDa).
Figure 6.
Figure 6.
Shen Shuai II Recipe (SSR) suppresses NLRP3 inflammasome activation and fibrosis signaling in CKD models. (A) to (E) Western blot results of the effect of SSR on the expression of NLRP3, pro-caspase-1, caspase-1, ASC, IL-1β and IL-18 in 5/6 (A/I) rats. #: Compared with the sham-operated group, #p < .05, ##p < .01.*: Compared with the NC group, *p < .05, **p < .01. (F) and (G) Western blot results of the effect of SSR on the expression of HIF-1α in hypoxia HK-2 cells. #: Compared with the normoxia group, ##p < .01.*: Compared with the 0 μg/ml group, **p < .01. Protein bands: HIF-1α (1:2000, 110 KDa), α-tubulin (1:2000, 52 KDa). (H) to (K) Western blot results of the effect of SSR on the expression of FN, α-SMA and Col-I in hypoxia HK-2 cells. #: Compared with the normoxia group, #p < .05, ##p < .01.*: Compared with the 0 μg/ml group, *p < .05, **p < .01. Protein bands: FN (1:2000, 270 KDa), Col-I (1:2000, 220 KDa), α-SMA (1:1000, 43 KDa), α-tubulin(1:2000,52 KDa). (L) Western blot results of the effect of SSR on the expression of p-NF-κB, IL-1β, and IL-18 in hypoxia HK-2 cells. Protein bands: P-NF-κB (1:1000, 65 KDa), IL-1β (1:1000, 30 KDa), IL-18 (1:1000, 22 KDa), α-tubulin (1:2000, 52 KDa).
Figure 7.
Figure 7.
SSR synergizes with MCC950 to suppress hypoxia-driven inflammatory and fibrotic markers in HK-2 cells (A) to (C) Western blot results of the effect of SSR on the expression of p-NF-κB, IL-1β and IL-18 in hypoxia HK-2 cells. #: Compared with the normoxia group, #p < .05, ##p < .01.*: Compared with the 0 μg/ml group, *p < .05, **p < .01. (D) The levels of IL-1β in the culture medium of HK-2 cells treated with SSR. #: Compared with the normoxia group, ##p < .01.*: Compared with the 0 μg/ml group, *p < .05, **p < .01. (E) The levels of HMGB1 in the culture medium of HK-2 cells treated with SSR. #: Compared with the normoxia group, ##p < .01.*: Compared with the 0 μg/ml group, **p < .01. (F) The levels of Ang-II in the culture medium of HK-2 cells treated with SSR. #: Compared with the normoxia group, ##p < .01.*: Compared with the 0 μg/ml group, **p < .01. (G) to (K) Western blot results of the effect of SSR and MCC950 on the expression of HIF-1α, FN, α-SMA and Col-I in hypoxia HK-2 cells. #: Compared with the normoxia group, ##p < .01.*: Compared with the NC group, *p < .05, **p < .01. Compared with hypoxia + SSR group, △p < .05, △△p < .01. Protein bands: HIF-1α (1:2000, 110 KDa), FN (1:2000, 270 KDa), col-I (1:2000, 220 KDa), α-SMA (1:1000, 43KDa), α-tubulin(1:2000, 52 KDa). (L) to (N) Western blot results of the effect of SSR and MCC950 on the expression of IL-1β and IL-18 in hypoxia HK-2 cells. #: Compared with the normoxia group, ##p < .01.*: Compared with the NC group, *p < .05, **p < .01. NC: negative control. MCC950: Selective inhibitor of NLRP3 inflammasome. Protein bands: IL-1β (1:1000, 30 KDa), IL-18 (1:1000, 22 KDa), α-tubulin(1:2000, 52 KDa).
Figure 8.
Figure 8.
SSR synergizes with MCC950 and MyD88 siRNA to suppress NLRP3 inflammasome and TLR4/MyD88/NF-κB signaling. (A) to (D) Western blot results of the effect of SSR and MCC950 on the expression of NLRP3, caspase-1 and ASC in hypoxia HK-2 cells. #: Compared with the normoxia group, ##p < .01.*: Compared with the NC group, *p < .05, **p < .01. NC: negative control. Protein bands: NLRP3 (1:1000, 110 KDa), caspase-1 (1:2000, 45 KDa), ASC (1:1000, 15 KDa), α-tubulin (1:2000, 52 KDa). (E) to (H) Western blot results of the effect of SSR on the expression of TLR4, MyD88, and P-NF-κB in 5/6 (A/I) rats. #: Compared with the sham-operated group, ##p < .01.*: Compared with the NC group, **p < .01. Protein bands: TLR4 (1:1000, 96 KDa), MyD88 (1:2000, 33KDa), P-NF-κB (1:1000, 65KDa), β-actin (1:2000, 42 KDa). (I) to (M) Western blot results of the effect of SSR and MyD88siRNA on the expression of HIF-1α, FN, α-SMA and Col-I in hypoxia HK-2 cells. #: Compared with the normoxia group, ##p < .01.*: Compared with the NC group, *p < .05, **p < .01. NC: negative control. Protein bands: HIF-1α (1:2000, 110 KDa), FN (1:2000, 270 KDa), Col-I (1:2000, 220 KDa), α-SMA (1:1000, 43 KDa), α-tubulin (1:2000, 52 KDa).
Figure 9.
Figure 9.
Synergistic inhibition of inflammatory and fibrotic pathways by SSR and MyD88 siRNA in hypoxic HK-2 cells. (A) to (D) Western blot results of the effect of SSR and MyD88siRNA on the expression of IL-1β, IL-18 and TNF-α and in hypoxia HK-2 cells. #: Compared with the normoxia group, ##p < .01.*: Compared with the NC group, *p < .05, **p < .01. Compared with hypoxia + SSR group, △p < .05, △△p < .01. Protein bands: IL-1β (1:1000, 30KDa), IL-18 (1:1000, 22KDa), TNF-α (1:1000, 17KDa), α-tubulin (1:2000, 52 KDa). (E) to (H) Western blot results of the effect of SSR and MyD88siRNA on the expression of NLRP3, caspase-1 and ASC and in hypoxia HK-2 cells induced by hypoxia. #: Compared with the normoxia group, ##p < .01.*: Compared with the NC group, *p < .05, **p < .01. Compared with hypoxia + SSR group, △p < .05, △△p < .01. Protein bands: NLRP3 (1:1000, 110 KDa), caspase-1 (1:2000, 45 KDa), ASC (1:1000, 15 KDa), α-tubulin (1:2000, 52 KDa). (I) to (L) Western blot results of the effect of SSR and MyD88siRNA on the expression of TLR4、MyD88 and P-NF-κB and in hypoxia HK-2 cells. #: Compared with the normoxia group, ##p < .01.*: Compared with the NC group, *p < .05, **p < .01. Compared with hypoxia + SSR group, △p < 0.05. Protein bands: TLR4 (1:1000, 96 KDa), MyD88 (1:2000, 33 KDa), P-NF-κB (1:1000, 65 KDa), α-tubulin (1:2000, 52 KDa). (M) Immunofluorescence staining of IL-1β (green) and DAPI (blue) in HK-2 cells induced by hypoxia. NC: negative control. Scale bar: 100 μm.

Similar articles

References

    1. Deng Y, Li N, Wu Y, et al. . Global, regional, and national burden of diabetes-related chronic kidney disease from 1990 to 2019. Front Endocrinol. 2021;12:672350. doi: 10.3389/fendo.2021.672350. - DOI - PMC - PubMed
    1. Harada R, Hamasaki Y, Okuda Y, et al. . Epidemiology of pediatric chronic kidney disease/kidney failure: learning from registries and cohort studies. Pediatr Nephrol. 2022;37(6):1215–1229. doi: 10.1007/s00467-021-05145-1. - DOI - PubMed
    1. Szlagor M, Dybiec J, Młynarska E, et al. . Chronic kidney disease as a comorbidity in heart failure. Int J Mol Sci. 2023;24(3):2988. doi: 10.3390/ijms24032988. - DOI - PMC - PubMed
    1. Wei X, Hou Y, Long M, et al. . Advances in energy metabolism in renal fibrosis. Life Sci. 2023;312:121033. doi: 10.1016/j.lfs.2022.121033. - DOI - PubMed
    1. Wang B, Li Z-L, Zhang Y-L, et al. . Hypoxia and chronic kidney disease. EBioMedicine. 2022;77:103942. doi: 10.1016/j.ebiom.2022.103942. - DOI - PMC - PubMed

MeSH terms