Comparative Study
. 2025 Jun;34(6):e70155.
doi: 10.1002/pro.70155.

A quantitative comparison of the deleteriousness of missense and nonsense mutations using the structurally resolved human protein interactome

Affiliations
Comparative Study

A quantitative comparison of the deleteriousness of missense and nonsense mutations using the structurally resolved human protein interactome

Ting-Yi Su et al. Protein Sci. 2025 Jun.

Abstract

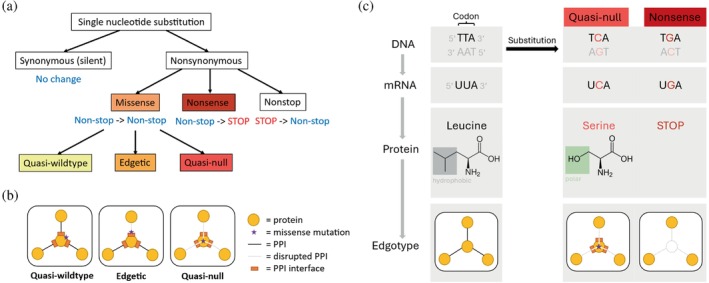
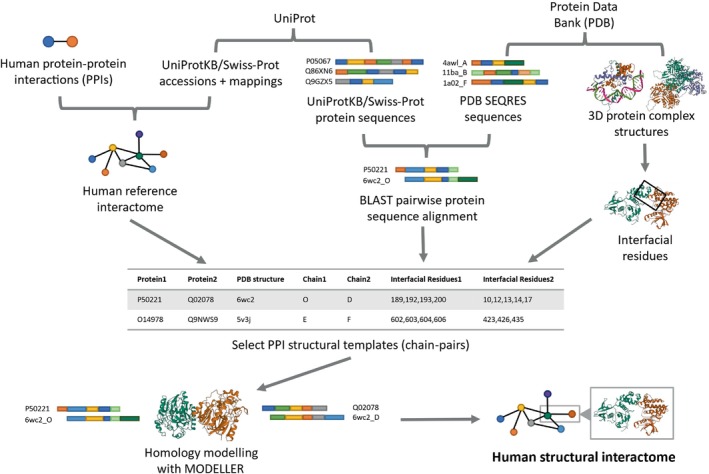
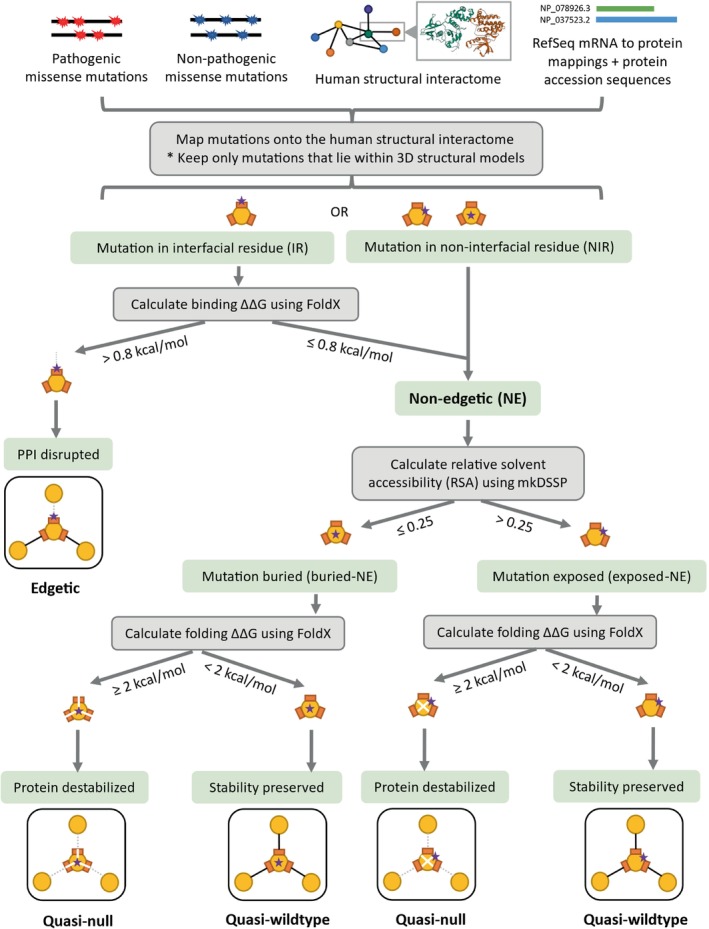
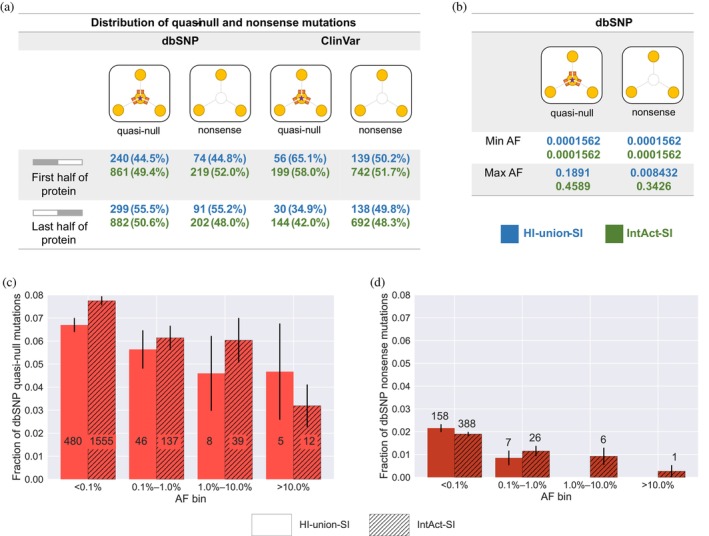
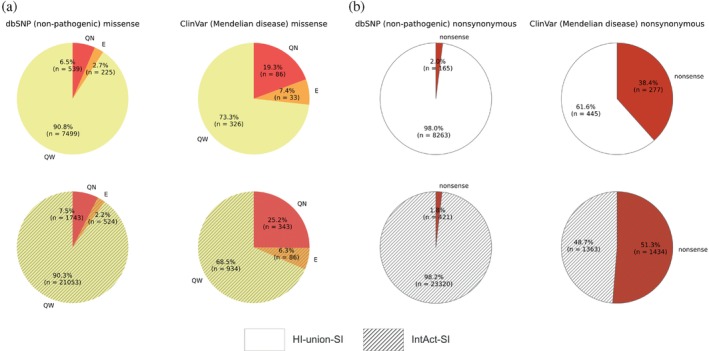
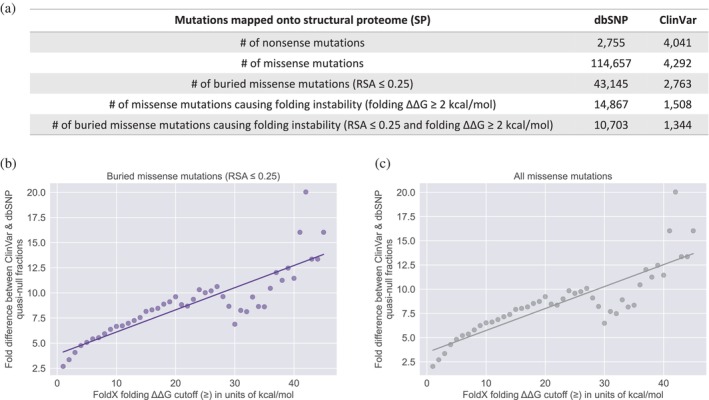
The complex genotype-to-phenotype relationships in Mendelian diseases can be elucidated by mutation-induced disturbances to the networks of molecular interactions (interactomes) in human cells. Missense and nonsense mutations cause distinct perturbations within the human protein interactome, leading to functional and phenotypic effects with varying degrees of severity. Here, we structurally resolve the human protein interactome at atomic-level resolutions and perform structural and thermodynamic calculations to assess the biophysical implications of these mutations. We focus on a specific type of missense mutation, known as "quasi-null" mutations, which destabilize proteins and cause similar functional consequences (node removal) to nonsense mutations. We propose a "fold difference" quantification of deleteriousness, which measures the ratio between the fractions of node-removal mutations in datasets of Mendelian disease-causing and non-pathogenic mutations. We estimate the fold differences of node-removal mutations to range from 3 (for quasi-null mutations with folding ΔΔG ≥2 kcal/mol) to 20 (for nonsense mutations). We observe a strong positive correlation between biophysical destabilization and phenotypic deleteriousness, demonstrating that the deleteriousness of quasi-null mutations spans a continuous spectrum, with nonsense mutations at the extreme (highly deleterious) end. Our findings substantiate the disparity in phenotypic severity between missense and nonsense mutations and suggest that mutation-induced protein destabilization is indicative of the phenotypic outcomes of missense mutations. Our analyses of node-removal mutations allow for the potential identification of proteins whose removal or destabilization lead to harmful phenotypes, enabling the development of targeted therapeutic approaches, and enhancing comprehension of the intricate mechanisms governing genotype-to-phenotype relationships in clinically relevant diseases.

Keywords: Mendelian diseases; deleteriousness of mutations; functional consequences; genotype‐to‐phenotype relationships; human genetic variants; human protein interactome; interactome disruptions; missense and nonsense mutations; protein stability; structural systems biology.


Figures

FIGURE 1
FIGURE 1
Depiction of two types of nonsynonymous single nucleotide substitutions: missense and nonsense mutations. (a) Single nucleotide substitution tree illustrating the relationship between missense (orange) and nonsense (dark red) mutations. A missense mutation is a nonsynonymous substitution in which a non‐stop codon is changed into another, resulting in a change in amino acid in the protein. A missense mutation can be categorized into three different “edgotype” classes (quasi‐wildtype, edgetic, and quasi‐null) based on its edge‐specific effects on the protein interactome. A nonsense mutation is a nonsynonymous substitution in which a non‐stop codon corresponding to an amino acid is changed to a stop codon. (b) Diagram portraying the interactome perturbations of quasi‐wildtype (left), edgetic (middle), and quasi‐null (right) mutations. (c) A comparison of quasi‐null (bright red) and nonsense (dark red) mutations at the DNA, mRNA, protein, and edgotype levels.
FIGURE 2
FIGURE 2
Computational pipeline for building a human structural interactome (SI) from human binary PPIs. Two SIs were constructed, HI‐union‐SI and IntAct‐SI, from the HI‐union (Luck et al., 2020) and IntAct (del Toro et al., 2022) databases, respectively. 3D structural models for PPIs were constructed through MODELLER (Webb & Sali, 2016), using sequences from the UniProtKB/Swiss‐Prot (The UniProt Consortium, 2023) database, SEQRES sequences and 3D structures from the Protein Data Bank (PDB) (Berman et al., 2000), and the BLAST (Camacho et al., 2009) protein alignment tool (BLASTP).
FIGURE 3
FIGURE 3
Computational pipeline for mapping missense mutations onto a structural interactome, determining their locations within the 3D protein structures, and predicting their edgotypes (quasi‐wildtype, edgetic, or quasi‐null). Mutations were mapped onto the HI‐union‐SI and IntAct‐SI using protein accession mappings and sequences from RefSeq (O'Leary et al., 2016). Edgotypes were predicted based on mutation locations, FoldX version 5 (Delgado et al., , ; Schymkowitz et al., 2005) binding and folding ΔΔG calculations, and relative solvent accessibility (RSA) values (Kabsch & Sander, ; Sydykova et al., 2018). The binding ΔΔG threshold was derived from the FoldX estimated error (Guerois et al., 2002). Thresholds for folding ΔΔG and RSA were established by previous studies (Ghadie & Xia, , ; Gong et al., ; Xu et al., 2012).
FIGURE 4
FIGURE 4
Comparing the positions and allele frequencies (AFs) of quasi‐null and nonsense mutations. AFs were obtained for dbSNP non‐pathogenic variants from the 1000 Genomes phase 3 project (Byrska‐Bishop et al., 2022). dbSNP mutations were categorized into four AF bins: <0.1%, 0.1%–1.0%, 1.0%–10.0%, and >10.0%. (a) Table presenting the numbers and percentages of dbSNP non‐pathogenic and ClinVar Mendelian disease‐causing quasi‐null and nonsense mutations distributed across either the first half or last half of the proteins in the HI‐union‐SI (blue) and IntAct‐SI (green). (b) Table displaying the minimum and maximum AFs of dbSNP quasi‐null and nonsense variants in proteins within the HI‐union‐SI (blue) and IntAct‐SI (green). (c) Fractions of dbSNP quasi‐null variants in proteins within the HI‐union‐SI (unhatched bars) and IntAct‐SI (hatched bars) across the four AF bins. The number on each bar indicates the number of quasi‐null variants in each bin. Error bars represent the standard error. (d) Fractions of dbSNP nonsense variants in proteins within the HI‐union‐SI (unhatched bars) and IntAct‐SI (hatched bars) across the four AF bins. The number on top of each bar indicates the number of nonsense variants in each bin. Error bars represent the standard error. The HI‐union‐SI contains nonsense mutations only in the two rarest AF bins (<0.1% and 0.1%–1.0%).
FIGURE 5
FIGURE 5
Evaluating quasi‐null and nonsense mutations through calculations of the fold difference between ClinVar Mendelian disease‐causing and dbSNP non‐pathogenic fractions. (a) Piecharts displaying the numbers and percentages of quasi‐wildtype (QW, yellow), edgetic (E, orange), and quasi‐null (QN, bright red) mutations among the dbSNP non‐pathogenic (left column) and ClinVar Mendelian disease‐causing (right column) missense mutations affecting proteins in the HI‐union‐SI (top row, unhatched) and IntAct‐SI (bottom row, hatched). (b) Piecharts displaying the numbers and percentages of nonsense mutations (dark red) among the dbSNP non‐pathogenic (left column) and ClinVar Mendelian disease‐causing (right column) nonsynonymous mutations affecting proteins in the HI‐union‐SI (top row, unhatched) and IntAct‐SI (bottom row, hatched). Nonsynonymous mutations included missense and nonsense mutations; nonstop mutations were excluded due to data scarcity and the inability to map them onto proteins in the SIs.
FIGURE 6
FIGURE 6
Assessing the range in fold differences of quasi‐null mutations mapped onto a structural proteome (SP) constructed from the UniProtKB/Swiss‐Prot human proteome. (a) Table depicting the numbers of nonsense mutations, missense mutations, buried missense mutations (RSA ≤0.25), missense mutations causing protein folding instability (folding ΔΔG ≥2 kcal/mol), and buried missense mutations causing folding instability (RSA ≤0.25 and folding ΔΔG ≥2 kcal/mol) within our supersets of dbSNP and ClinVar mutations. These supersets of nonsense and missense mutations were mapped onto our SP, instead of our two SIs. Plots portraying the positive linear correlation between fold differences (between ClinVar and dbSNP quasi‐null fractions) and folding ΔΔG cutoffs ranging from 1 kcal/mol (mildly unstable folding) to 45 kcal/mol (extremely unstable folding), for two possible definitions of quasi‐null mutations: (b) buried missense mutations (RSA ≤0.25) that meet a specific folding ΔΔG threshold and (c) all missense mutations that satisfy a certain folding ΔΔG cutoff, without considering RSA values.
FIGURE 7
FIGURE 7
Investigating potential confounders that may influence fold difference and folding ΔΔG calculations using our supersets of dbSNP and ClinVar quasi‐null and nonsense mutations that were mapped onto our structural proteome. Here we defined a missense mutation to be quasi‐null if it has RSA ≤0.25 (buried in the core of the protein and thus more likely to be non‐edgetic) and folding ΔΔG ≥2 kcal/mol. (a) Table portraying the mean, median, and mode for three potential confounding factors: (1) length of Swiss‐Prot protein over length of RefSeq protein, (2) length of RefSeq protein over length of Swiss‐Prot protein, and (3) length of homology model over length of Swiss‐Prot protein. The mean, median, and mode values for (1) and (2) are all either 1.0 or nearly 1.0, indicating that discrepancies in the lengths of RefSeq and Swiss‐Prot proteins may not be a confounding factor. Quasi‐null and nonsense mutations were categorized into five bins for (3): (0.0, 0.2], (0.2, 0.4], (0.4, 0.6], (0.6, 0.8], (0.8, 1.0]. Plots illustrating the distributions of the lengths of the homology models and Swiss‐Prot proteins containing (b) dbSNP quasi‐null, (c) ClinVar quasi‐null, (d) dbSNP nonsense, and (e) ClinVar nonsense mutations.
FIGURE 8
FIGURE 8
Exploring the potential for the fold differences of quasi‐null and nonsense mutations (mapped onto our structural proteome) to be confounded by the extent of the homology models' coverages of the Swiss‐Prot proteins the mutations occur in. For each quasi‐null and nonsense mutation, we calculated the ratio of the length of the homology model to the length of the Swiss‐Prot protein containing the mutation and categorized the mutation into five bins based on this ratio: (0.0, 0.2], (0.2, 0.4], (0.4, 0.6], (0.6, 0.8], (0.8, 1.0]. (a) Plot illustrating the fold difference between the ClinVar and dbSNP quasi‐null fractions across the five bins. The fold difference remains around 3 across each bin. In each bar, “c” and “d” represent the number of ClinVar and dbSNP quasi‐null mutations, respectively. (b) Plot depicting the fold difference between the ClinVar and dbSNP nonsense fractions across the five bins. The fold difference remains around 20 across each bin. In each bar, “c” and “d” represent the number of ClinVar and dbSNP nonsense mutations, respectively. (c) Plot illustrating the overall decrease in the mean folding ΔΔG of ClinVar (blue) and dbSNP (green) quasi‐null mutations across the five bins. The number in each bar indicates the number of quasi‐null mutations. (d) Table displaying the mean length of the homology models containing ClinVar and dbSNP quasi‐null and nonsense mutations across the five bins. The mean length generally increases with an increase in coverage of the homology models.
FIGURE 9
FIGURE 9
Investigating the functional roles of dbSNP non‐pathogenic node‐removal (quasi‐null or nonsense) mutations in the structural proteome. A total of 3798 (out of 3817) Swiss‐Prot proteins containing dbSNP quasi‐null mutations and 1824 (out of 1836) Swiss‐Prot proteins containing dbSNP nonsense proteins were present in the Reactome pathway database (Milacic et al., 2024). A total of 1361 Swiss‐Prot proteins were found to contain both dbSNP quasi‐null and nonsense mutations. Pathways are colored based on the following broad categories: sensory perception (purple), metabolism (green), immune system (blue), GPCR (G protein‐coupled receptor) signaling (black), and unclassified (gray). The fold enrichment of each pathway is displayed on top of the corresponding bar. The number of proteins found in each pathway is listed in parentheses next to the pathway name. Figures showing the top 20 most significant Reactome pathways of proteins containing dbSNP (a) quasi‐null and (b) nonsense mutations. (c) Table depicting a case study of a specific gene within each of the sensory perception (purple) and metabolism (green) categories.

Similar articles

References

    1. Abramson J, Adler J, Dunger J, Evans R, Green T, Pritzel A, et al. Accurate structure prediction of biomolecular interactions with AlphaFold 3. Nature. 2024;630(8016):493–500. 10.1038/s41586-024-07487-w - DOI - PMC - PubMed
    1. Adzhubei IA, Schmidt S, Peshkin L, Ramensky VE, Gerasimova A, Bork P, et al. A method and server for predicting damaging missense mutations. Nat Methods. 2010;7(4):248–249. 10.1038/nmeth0410-248 - DOI - PMC - PubMed
    1. Akdel M, Pires DEV, Pardo EP, Jänes J, Zalevsky AO, Mészáros B, et al. A structural biology community assessment of AlphaFold2 applications. Nat Struct Mol Biol. 2022;29(11):1056–1067. 10.1038/s41594-022-00849-w - DOI - PMC - PubMed
    1. Akrodou YM. CYP2A6 polymorphisms may strengthen individualized treatment for nicotine dependence. Scientifica. 2015;2015(1):491514. 10.1155/2015/491514 - DOI - PMC - PubMed
    1. Araneda RC, Firestein S. The scents of androstenone in humans. J Physiol. 2004;554(Pt 1):1. 10.1113/jphysiol.2003.057075 - DOI - PMC - PubMed

Publication types

LinkOut - more resources