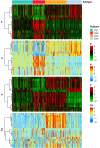
Identification of intrinsic imaging subtypes using clustering analysis based on dynamic contrast-enhanced magnetic resonance imaging radiomics features for gliomas: preliminary associations with gene expression profiles
- PMID: 40384650
- PMCID: PMC12082578
- DOI: 10.21037/qims-24-1459
Identification of intrinsic imaging subtypes using clustering analysis based on dynamic contrast-enhanced magnetic resonance imaging radiomics features for gliomas: preliminary associations with gene expression profiles
Abstract
Background: There has been no research based on dynamic contrast-enhanced magnetic resonance imaging (DCE-MRI) radiomics for the stratification diagnosis and prognostic evaluation of gliomas. The study aimed to identify multiple glioma subtypes and decipher the gene expression profiles linked with different subtypes.
Methods: Cross-sectional and retrospective data of 189 patients were collected. The static radiomics features were obtained at three time points (0, 90, and 300 s) corresponding to pre-contrast, arterial, and delayed phases, respectively. The dynamic radiomics features were retrieved by determining the temporal anisotropy of these three phases. Multi-omics clustering was used to identify intrinsic radiomics subtypes within the cohort. The association between the radiomics clusters and gene expression profiles was evaluated through the analysis of variance.
Results: The patients in cluster 3 were oldest. Cluster 3 and cluster 1 had higher frequency of grade 4, high Ki-67 level, glioblastoma isocitrate dehydrogenase (IDH) wild-type, and unmethylated O6-methylguanine-DNA methyltransferase (MGMT) promoter. Cluster 3 had the highest frequency of epidermal growth factor receptor (EGFR) amplification and cyclin-dependent kinase inhibitor (CDKN) 2A/B homozygous deletion. Cluster 1 had the highest frequency of EGFR non-mutant. Cluster 4 and cluster 2 had a higher frequency of astrocytoma IDH-mutant. Cluster 4 had a higher frequency of grade 3, oligodendroglioma IDH-mutant and 1p/19q codeleted, MGMT promoter methylation, and EGFR non-amplification. Cluster 2 had a higher frequency of grade 2, low Ki-67 level, and patients without CDKN 2A/B homozygous deletion. There were no associations for other molecular markers between clusters.
Conclusions: The intrinsic imaging subtypes obtained from DCE-MRI radiomics features provide a new insight into glioma classification, potentially guiding the diagnosis.
Keywords: Dynamic contrast-enhanced (DCE); diagnosis; glioma; radiomics.
Copyright © 2025 AME Publishing Company. All rights reserved.
Conflict of interest statement
Conflicts of Interest: All authors have completed the ICMJE uniform disclosure form (available at https://qims.amegroups.com/article/view/10.21037/qims-24-1459/coif). The authors have no conflicts of interest to declare.
Figures


Similar articles
-
CDKN2A homozygous deletion is a strong adverse prognosis factor in diffuse malignant IDH-mutant gliomas.Neuro Oncol. 2019 Dec 17;21(12):1519-1528. doi: 10.1093/neuonc/noz124. Neuro Oncol. 2019. PMID: 31832685 Free PMC article.
-
Clinical prognostic value of isocitrate dehydrogenase mutation, O-6-methylguanine-DNA methyltransferase promoter methylation, and 1p19q co-deletion in glioma patients.Ann Transl Med. 2019 Oct;7(20):541. doi: 10.21037/atm.2019.09.126. Ann Transl Med. 2019. PMID: 31807523 Free PMC article.
-
Association of MGMT Promoter Methylation With Survival in Low-grade and Anaplastic Gliomas After Alkylating Chemotherapy.JAMA Oncol. 2023 Jul 1;9(7):919-927. doi: 10.1001/jamaoncol.2023.0990. JAMA Oncol. 2023. PMID: 37200021 Free PMC article.
-
O6-methylguanine DNA methyltransferase gene promoter methylation status in gliomas and its correlation with other molecular alterations: first Indian report with review of challenges for use in customized treatment.Neurosurgery. 2010 Dec;67(6):1681-91. doi: 10.1227/NEU.0b013e3181f743f5. Neurosurgery. 2010. PMID: 21107199 Review.
-
Quality assessment of the MRI-radiomics studies for MGMT promoter methylation prediction in glioma: a systematic review and meta-analysis.Eur Radiol. 2024 Sep;34(9):5802-5815. doi: 10.1007/s00330-024-10594-x. Epub 2024 Feb 3. Eur Radiol. 2024. PMID: 38308012 Free PMC article.
References
-
- Louis DN, Perry A, Wesseling P, Brat DJ, Cree IA, Figarella-Branger D, Hawkins C, Ng HK, Pfister SM, Reifenberger G, Soffietti R, von Deimling A, Ellison DW. The 2021 WHO Classification of Tumors of the Central Nervous System: a summary. Neuro Oncol 2021;23:1231-51. 10.1093/neuonc/noab106 - DOI - PMC - PubMed
LinkOut - more resources
Full Text Sources
Research Materials
Miscellaneous
