

Time-variant and tissue-level collaterals predict postoperative neurological recovery and clinical outcomes of patients with endovascular thrombectomy
- PMID: 40384651
- PMCID: PMC12084686
- DOI: 10.21037/qims-24-1073
Time-variant and tissue-level collaterals predict postoperative neurological recovery and clinical outcomes of patients with endovascular thrombectomy
Abstract
Background: A comprehensive assessment of collateral status can yield profound insights into the ischemic mechanism in patients experiencing acute ischemic stroke. This study aims to investigate whether time-variant and tissue-level collateral characteristics may serve as predictors for functional outcomes in patients undergoing endovascular thrombectomy (EVT) through the application of machine learning (ML) algorithms, and to stratify postoperative neurological recovery of these patients.
Methods: In this retrospective study, 128 acute ischemic stroke patients characterized by anterior large-vessel occlusion and received EVT between May 2020 and December 2022 were enrolled. These patients underwent multiphase computed tomography (CT) angiography (mCTA) and CT perfusion (CTP). The time-variant collateral score was defined as the Collateral Score on Color-Coded summation maps (CSCC) of mCTA. The hypoperfusion intensity ratio (HIR) was calculated from CTP data. The data were split into training and test sets in a ratio of 7:3, and univariable and multivariable regression analyses were employed for feature selection. For ML analyses, logistic regression (LR), support vector machine (SVM), random forest (RF), decision tree (DT), and eXtreme gradient boosting (XGBoost) algorithms were utilized. The receiver operating characteristic (ROC) curve and decision curve were employed for performance evaluation. The mixed effect model was established to estimate the impact of collateral stratification on the postoperative National Institutes of Health Stroke Scale (NIHSS).
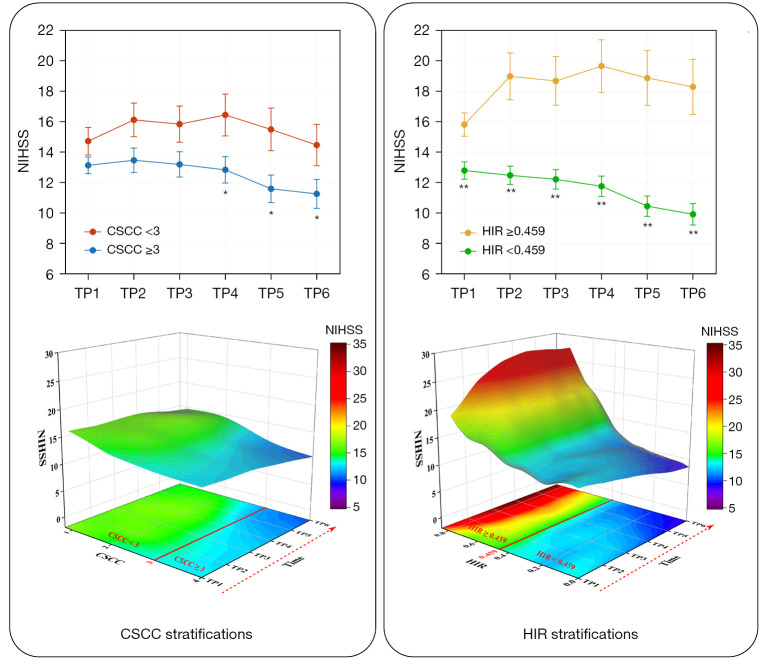
Results: Age [odds ratio (OR) =1.073; 95% confidence interval (CI): 1.008, 1.154; P=0.040], Alberta Stroke Program Early CT Score (ASPECTS) (OR =0.742; 95% CI: 0.546, 0.975; P=0.040), CSCC (OR =0.468; 95% CI: 0.213, 0.953; P=0.044), and HIR (OR =56.666; 95% CI: 3.843, 1,156.959; P=0.005) were significantly associated with good outcome in training set. By utilizing these four selected features, the RF algorithm achieved the best performance and the highest clinical suitability in predicting good clinical outcomes, with an area under the ROC curve (AUC) of 0.964 (95% CI: 0.902, 0.992) and 0.837 (95% CI: 0.684, 0.935) in training set and testing set, respectively. The Shapley Additive exPlanations (SHAP) analysis revealed that HIR was the most significant variable in predicting clinical outcomes. Fixed effects and group × time interaction effects [all P<0.01 at all time points (TPs)] were acquired in HIR stratification. HIR enabled better stratification and prediction of patients' postoperative NIHSS [Akaike information criterion (AIC): HIR =4,599.577 and CSCC =4,648.707].
Conclusions: RF model, which has been trained on time-variant and tissue-level collaterals, is capable of accurately predicting the clinical outcomes of patients undergoing EVT. Stratifying patients based on HIR may yield valuable insights into predicting trends in the potential postoperative neurological recovery.
Keywords: Ischemic stroke; collateral circulation; computed tomography angiography (CTA); machine learning (ML); thrombectomy.
Copyright © 2025 AME Publishing Company. All rights reserved.
Conflict of interest statement
Conflicts of Interest: All authors have completed the ICMJE uniform disclosure form (available at https://qims.amegroups.com/article/view/10.21037/qims-24-1073/coif). L.W. is from CT Imaging Research Center, GE Healthcare China. The other authors have no conflicts of interest to declare.
Figures


Similar articles
-
Importance of computed tomography perfusion on assessing collateral circulation and prognosis of patients with acute anterior circulation large vessel occlusion after endovascular therapy.SLAS Technol. 2024 Aug;29(4):100139. doi: 10.1016/j.slast.2024.100139. Epub 2024 May 9. SLAS Technol. 2024. PMID: 38734181
-
CTP-Derived venous outflow profiles correlate with tissue-level collaterals regardless of arterial collateral status.J Stroke Cerebrovasc Dis. 2025 Jan;34(1):108150. doi: 10.1016/j.jstrokecerebrovasdis.2024.108150. Epub 2024 Nov 19. J Stroke Cerebrovasc Dis. 2025. PMID: 39571665
-
Correlation between Hypoperfusion Intensity Ratio and Functional Outcome in Large-Vessel Occlusion Acute Ischemic Stroke: Comparison with Multi-Phase CT Angiography.J Clin Med. 2022 Sep 7;11(18):5274. doi: 10.3390/jcm11185274. J Clin Med. 2022. PMID: 36142924 Free PMC article.
-
Comparison of Computed Tomography Perfusion and Multiphase Computed Tomography Angiogram in Predicting Clinical Outcomes in Endovascular Thrombectomy.Stroke. 2022 Sep;53(9):2926-2934. doi: 10.1161/STROKEAHA.122.038576. Epub 2022 Jun 24. Stroke. 2022. PMID: 35748291
-
Hypoperfusion intensity ratio correlates with clinical outcome of endovascular thrombectomy in acute ischaemic stroke patients with late therapeutic window.Clin Radiol. 2022 Aug;77(8):570-576. doi: 10.1016/j.crad.2022.04.003. Epub 2022 May 18. Clin Radiol. 2022. PMID: 35595563
References
-
- Renú A, Millán M, San Román L, Blasco J, Martí-Fàbregas J, Terceño M, et al. Effect of Intra-arterial Alteplase vs Placebo Following Successful Thrombectomy on Functional Outcomes in Patients With Large Vessel Occlusion Acute Ischemic Stroke: The CHOICE Randomized Clinical Trial. JAMA 2022;327:826-35. 10.1001/jama.2022.1645 - DOI - PMC - PubMed
LinkOut - more resources
Full Text Sources