

A preliminary study of synthetic magnetic resonance imaging on the changes of subcortical gray matter nuclei in obstructive sleep apnea patients
- PMID: 40384657
- PMCID: PMC12082584
- DOI: 10.21037/qims-24-1830
A preliminary study of synthetic magnetic resonance imaging on the changes of subcortical gray matter nuclei in obstructive sleep apnea patients
Abstract
Background: Obstructive sleep apnea (OSA) is a relatively common sleep disorder, which can damage the brain structure and thus trigger cognitive impairment. We aimed to assess changes in volume and relaxation values of subcortical gray matter nuclei in patients with moderate to severe OSA using synthetic magnetic resonance imaging (SyMRI).
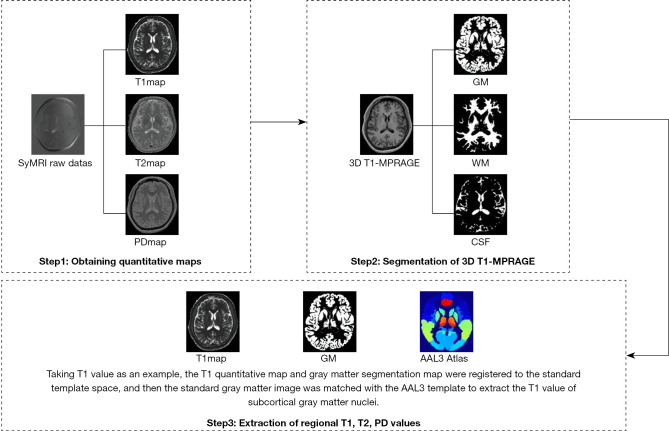
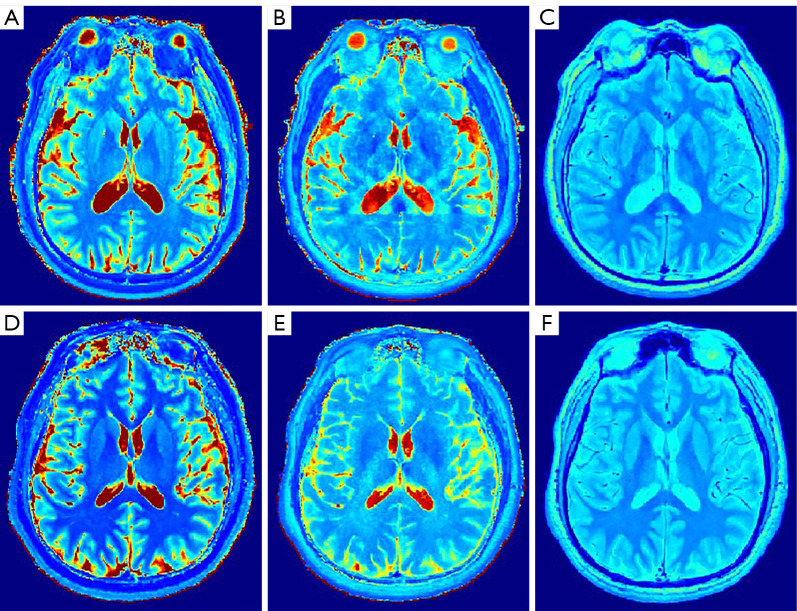
Methods: A total of 30 patients with moderate to severe OSA, newly diagnosed by polysomnography (PSG), and 30 age-, sex-, education-, and handedness-matched healthy controls (HC) were recruited. All participants underwent the Montreal Cognitive Assessment (MoCA) Scale. Conventional MRI, three-dimensional T1-weighted brain volume (3D T1-BRAVO), and SyMRI were performed on both groups using a 3.0TMR scanner. After scanning, original SyMRI data were post-processed using SyMRI8.0 software to automatically generate T1, T2, and proton density (PD) quantitative maps, and subcortical gray matter nuclei were obtained using SPM12 software (Matlab R2015b). Cognitive scale scores, subcortical gray matter nuclei volume, and relaxation quantitative values were compared between groups. Volume and relaxation quantitative values were corrected for multiple comparisons using a false discovery rate (FDR). SyMRI quantitative parameters with statistically significant differences underwent receiver operating characteristic (ROC) analysis to calculate the area under the curve (AUC). Correlations between changes in abnormal brain volume and relaxation values and MoCA scores were analyzed in the OSA group, using FDR for multiple comparisons and corrections.
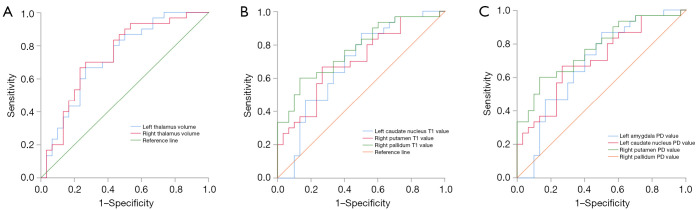
Results: Compared to controls, the OSA group exhibited a significant decrease in bilateral thalamic volume (P=0.002, 0.003, uncorrected). T1 values increased significantly in the left hippocampus, amygdala, caudate nucleus, right pallidum, thalamus, and bilateral putamen (P=0.02, 0.040, 0.01, <0.001, 0.03, 0.04, 0.004, uncorrected). The left hippocampus showed significantly increased T2 values (P=0.03, uncorrected). In contrast, the PD values increased significantly in the left amygdala, nucleus accumbens, right pallidum, putamen, bilateral caudate nucleus, and thalamus (P=0.02, 0.041, 0.01, 0.006, 0.007, 0.03, 0.047, 0.009, uncorrected). After FDR correction, significant differences persisted in the bilateral thalamic volume, T1 values of left caudate, right putamen and pallidum, PD values of left amygdala, right pallidum, putamen, bilateral caudate nucleus, and thalamus. ROC curve analysis revealed significant differences in bilateral thalamic volume, T1 values of left caudate nucleus, right putamen and pallidum, PD values of left amygdala, caudate nucleus, right putamen, pallidum, and thalamus between OSA patients and controls (P=0.002, 0.001, 0.01, 0.007, <0.001, 0.02, 0.007, 0.01, 0.01, 0.03; AUC 0.668-0.770). After controlling for age, body mass index (BMI), and years of education, OSA patients showed negative correlations between visual space and executive function and the right putamen T1 and PD values (r=-0.390, -0.449; P=0.045, 0.02) and positive correlations with the left amygdala PD value (r=0.397; P=0.04). No significant differences were found in partial correlation analysis after FDR correction.
Conclusions: SyMRI offers sensitive detection of abnormal volume and relaxation value changes in subcortical gray matter nuclei among patients with moderate to severe OSA. These findings provide valuable imaging information for quantifying subcortical gray matter nuclei damage in OSA and advancing our understanding of the neuropathological mechanisms underlying cognitive impairment.
Keywords: Obstructive sleep apnea (OSA); subcortical gray matter nuclei; synthetic magnetic resonance imaging (SyMRI).
Copyright © 2025 AME Publishing Company. All rights reserved.
Conflict of interest statement
Conflicts of Interest: All authors have completed the ICMJE uniform disclosure form (available at https://qims.amegroups.com/article/view/10.21037/qims-24-1830/coif). K.W. is an employee of GE Healthcare. The other authors have no conflicts of interest to declare.
Figures
References
-
- Mangione CM, Barry MJ, Nicholson WK, Cabana M, Chelmow D, Rucker Coker T, Davidson KW, Davis EM, Donahue KE, Jaén CR, Kubik M, Li L, Ogedegbe G, Pbert L, Ruiz JM, Stevermer J, Wong JB. Screening for Obstructive Sleep Apnea in Adults: US Preventive Services Task Force Recommendation Statement. JAMA 2022;328:1945-50. 10.1001/jama.2022.20304 - DOI - PubMed
-
- Benjafield AV, Ayas NT, Eastwood PR, Heinzer R, Ip MSM, Morrell MJ, Nunez CM, Patel SR, Penzel T, Pépin JL, Peppard PE, Sinha S, Tufik S, Valentine K, Malhotra A. Estimation of the global prevalence and burden of obstructive sleep apnoea: a literature-based analysis. Lancet Respir Med 2019;7:687-98. 10.1016/S2213-2600(19)30198-5 - DOI - PMC - PubMed
LinkOut - more resources
Full Text Sources