

Development and validation of a nomogram based on conventional and contrast-enhanced ultrasound for differentiating malignant from benign thyroid nodules
- PMID: 40384666
- PMCID: PMC12082573
- DOI: 10.21037/qims-24-1796
Development and validation of a nomogram based on conventional and contrast-enhanced ultrasound for differentiating malignant from benign thyroid nodules
Abstract
Background: Conventional ultrasound (US) has been routinely used for differential diagnosis of thyroid nodules, but its discriminatory performance remains unsatisfactory. This study aimed to develop and validate a prediction nomogram model based on conventional US and contrast-enhanced ultrasound (CEUS) features for differentiating malignant from benign thyroid nodules.
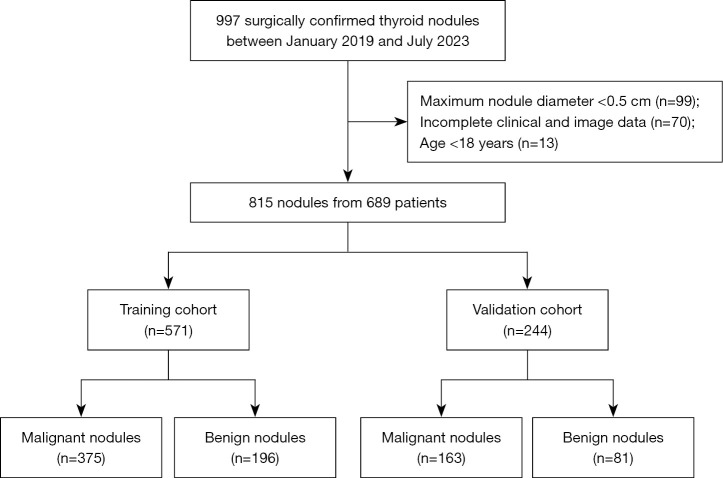
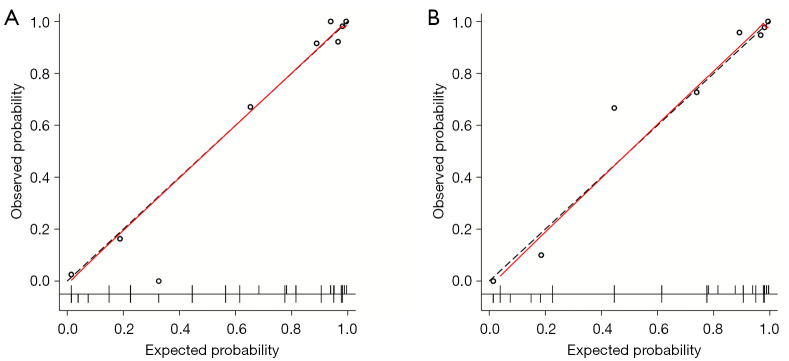
Methods: A total of 815 thyroid nodules with surgical pathology results and complete conventional US and CEUS data were retrospectively collected from the First People's Hospital of Qinzhou between January 2019 and July 2023. The nodules were grouped into a training cohort (n=571) and a validation cohort (n=244) at a 7:3 ratio. Independent risk factors of malignancy were selected by stepwise multivariate logistic regression analysis, and a prediction nomogram model was subsequently constructed. The diagnostic performance of the model was evaluated by the area under the receiver operating characteristic curve (AUC) in both the training and validation cohorts. The unnecessary fine-needle aspiration biopsy (FNAB) rate was calculated.
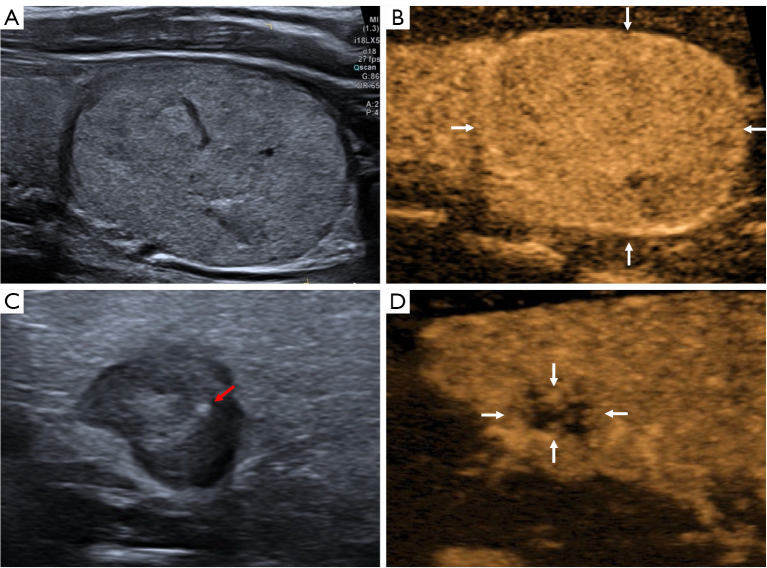
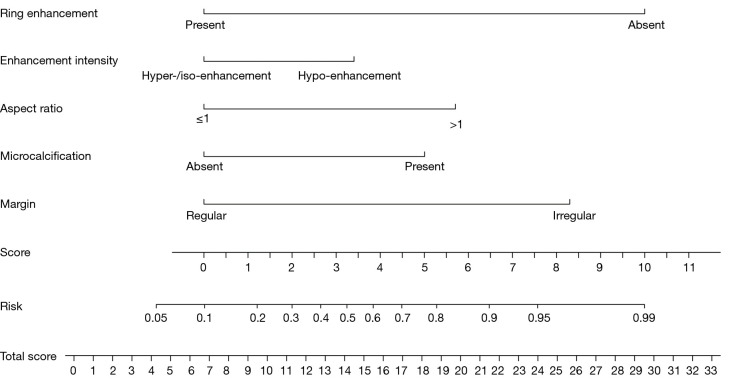
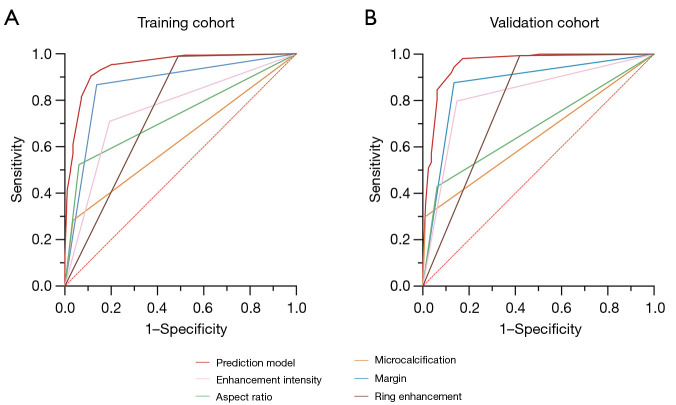
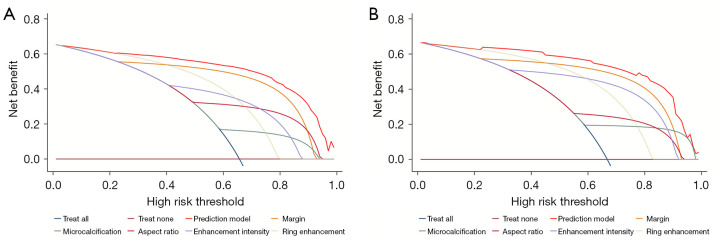
Results: Multivariate logistic regression analysis identified irregular margin, aspect ratio >1, and microcalcification from conventional US images, as well as hypo-enhancement intensity and ring enhancement from CEUS images, as independent predictors for malignancy. The AUC, sensitivity, specificity, and accuracy of the prediction nomogram model were 0.947 [95% confidence interval (CI): 0.928-0.966], 90.4%, 88.8%, and 89.8% in the training cohort, and 0.957 (95% CI: 0.928-0.986), 94.5%, 86.4%, and 91.8% in the validation cohort, respectively. Using the prediction model, the unnecessary FNAB rates reduced from 29.6% to 6.1% in the training cohort and from 29.3% to 6.7% in the validation cohort compared to the Chinese Thyroid Imaging Reporting and Data System. Decision curve analysis demonstrated good clinical utility of the nomogram model.
Conclusions: The prediction nomogram model incorporating conventional US and CEUS features could effectively distinguish between malignant and benign thyroid nodules and reduce unnecessary FNAB rates.
Keywords: Contrast-enhanced ultrasound (CEUS); malignancy; nomogram; thyroid nodules.
Copyright © 2025 AME Publishing Company. All rights reserved.
Conflict of interest statement
Conflicts of Interest: All authors have completed the ICMJE uniform disclosure form (available at https://qims.amegroups.com/article/view/10.21037/qims-24-1796/coif). The authors have no conflicts of interest to declare.
Figures
Similar articles
-
Development and Validation of a Nomogram Based on Multimodality Ultrasonography Images for Differentiating Malignant from Benign American College of Radiology Thyroid Imaging, Reporting and Data System (TI-RADS) 3-5 Thyroid Nodules.Ultrasound Med Biol. 2024 Apr;50(4):557-563. doi: 10.1016/j.ultrasmedbio.2023.12.020. Epub 2024 Jan 22. Ultrasound Med Biol. 2024. PMID: 38262884
-
Dual-modal radiomics nomogram based on contrast-enhanced ultrasound to improve differential diagnostic accuracy and reduce unnecessary biopsy rate in ACR TI-RADS 4-5 thyroid nodules.Cancer Imaging. 2024 Jan 23;24(1):17. doi: 10.1186/s40644-024-00661-3. Cancer Imaging. 2024. PMID: 38263209 Free PMC article.
-
The diagnostic value of a nomogram based on multimodal ultrasonography for thyroid-nodule differentiation: A multicenter study.Front Oncol. 2022 Aug 18;12:970758. doi: 10.3389/fonc.2022.970758. eCollection 2022. Front Oncol. 2022. PMID: 36059607 Free PMC article.
-
Predictors and a prediction model for positive fine needle aspiration biopsy in C-TIRADS 4 thyroid nodules.Front Endocrinol (Lausanne). 2023 Jul 24;14:1154984. doi: 10.3389/fendo.2023.1154984. eCollection 2023. Front Endocrinol (Lausanne). 2023. PMID: 37554760 Free PMC article.
-
Contrast-Enhanced Ultrasound in the Differential Diagnosis and Risk Stratification of ACR TI-RADS Category 4 and 5 Thyroid Nodules With Non-Hypovascular.Front Oncol. 2021 May 26;11:662273. doi: 10.3389/fonc.2021.662273. eCollection 2021. Front Oncol. 2021. PMID: 34123819 Free PMC article.
References
LinkOut - more resources
Full Text Sources