

Brain white matter microstructural alterations in patients with diabetic retinopathy: an automated fiber-tract quantification study
- PMID: 40384690
- PMCID: PMC12082598
- DOI: 10.21037/qims-24-1440
Brain white matter microstructural alterations in patients with diabetic retinopathy: an automated fiber-tract quantification study
Abstract
Background: Cognitive decline may occur in patients with diabetic retinopathy (DR), yet the mechanism underlying the relationship between cognitive decline and DR remains unclear. This study applied an automated fiber-tract quantification (AFQ) technique based on diffusion tensor imaging (DTI) to identify alterations in specific segments of brain white matter fiber tracts in patients with DR, and analyze their correlation with cognitive test scores and clinical biochemical indicators.
Methods: A total of 19 patients with DR and 20 age-, sex-, and education-matched healthy controls (HCs) were included. Clinical and imaging data were prospectively collected. The AFQ technique was applied to track the whole brain white matter fiber tracts of each participant, and each fiber tract was segmented into 100 equidistant nodes. The fractional anisotropy (FA), mean diffusion (MD), axial diffusion (AD), and radial diffusion in 100 nodes of each fiber tract were calculated and compared between the two groups. Partial correlation analysis was performed to analyze the correlation between altered DTI metrics in segments of the fiber tracts and cognitive test scores, as well as clinical biochemical indicators in patients with DR.
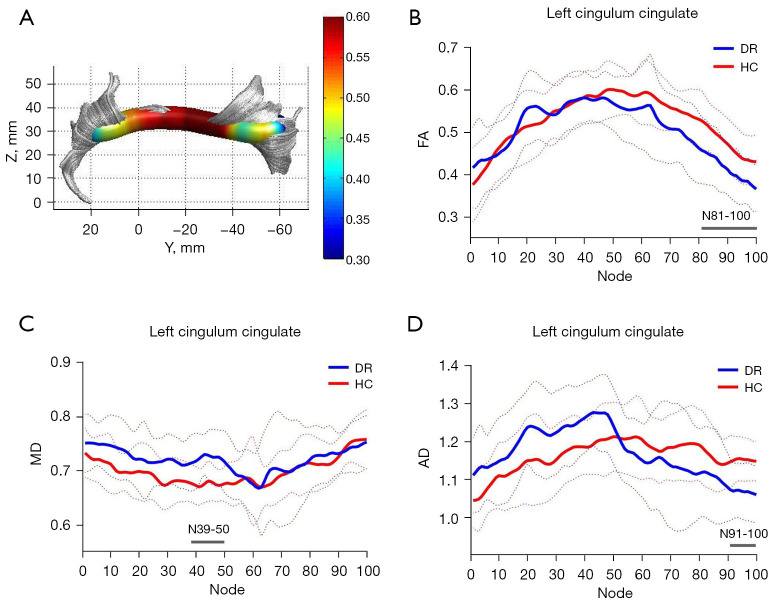
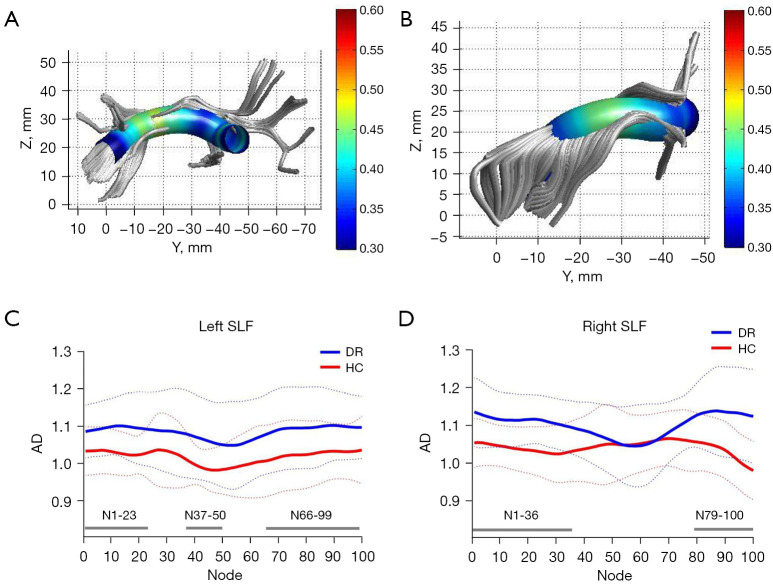
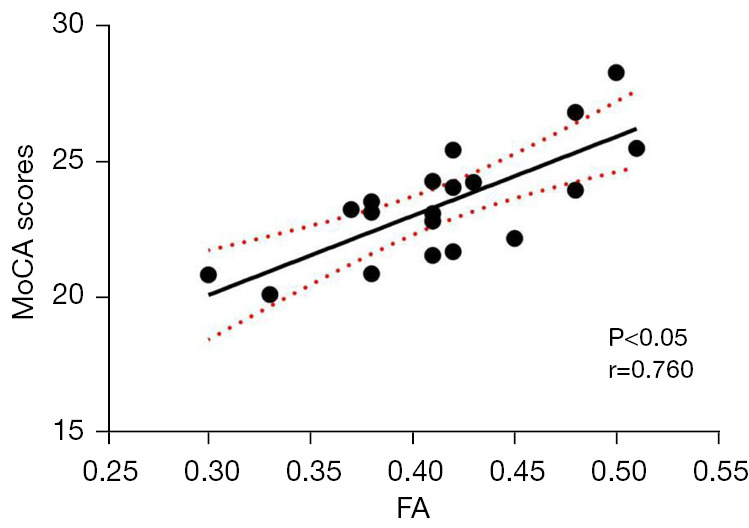
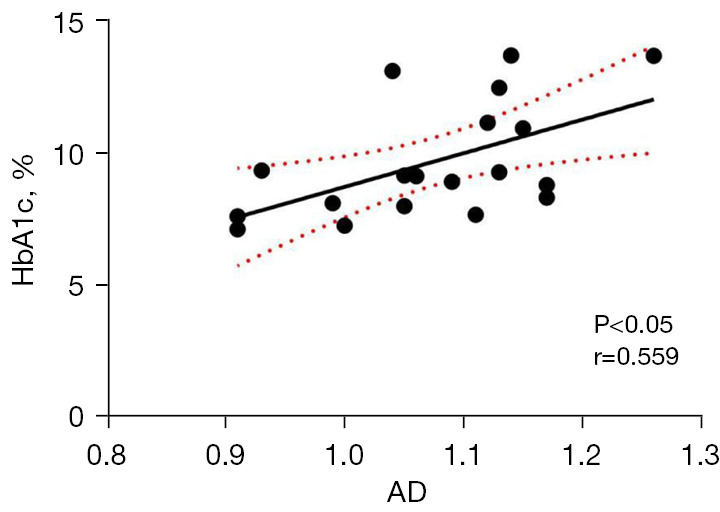
Results: Compared with the HC group, the DR group showed significantly reduced FA values in nodes 81-100, increased MD values in nodes 39-50, and reduced AD values in nodes 91-100 of the left cingulum cingulate (CGC) [P<0.05, false discovery rate (FDR) corrected], they also showed increased AD values in the left superior longitudinal fasciculus (SLF; nodes 1-23, 37-50, and 66-99), and the right SLF (nodes 1-36 and 79-100) (P<0.05, FDR corrected). Correlation analysis revealed a positive correlation between the FA values in nodes 82-98 of the left CGC and Montreal Cognitive Assessment scores (MoCA scores, r=0.760, P<0.05/P=0.021), and a positive correlation between the AD values in nodes 37-41 in the left SLF and glycated hemoglobin A1c (HbA1c) levels (r=0.559, P<0.05/P=0.039).
Conclusions: Our findings demonstrated alterations in the white matter fiber tracts at the point-wise level in patients with DR using AFQ analysis. These alterations may be associated with cognitive impairment in DR. The AFQ technique can accurately detect the damage to the integrity of the brain white matter fiber tracts in patients with DR, and have high clinical application value in the diagnosis and evaluation of DR, which can deepen our understanding of brain white matter microstructural abnormalities in patients with DR.
Keywords: Diabetic retinopathy (DR); automated fiber-tract quantification (AFQ); cognitive impairment; diffusion tensor imaging (DTI).
Copyright © 2025 AME Publishing Company. All rights reserved.
Conflict of interest statement
Conflicts of Interest: All authors have completed the ICMJE uniform disclosure form (available at https://qims.amegroups.com/article/view/10.21037/qims-24-1440/coif). The authors have no conflicts of interest to declare.
Figures
Similar articles
-
Brain white matter microstructural alterations in patients with systemic lupus erythematosus: an automated fiber quantification study.Brain Imaging Behav. 2024 Jun;18(3):622-629. doi: 10.1007/s11682-024-00861-2. Epub 2024 Feb 9. Brain Imaging Behav. 2024. PMID: 38332385
-
Alterations in White Matter Fiber Tracts Characterized by Automated Fiber-Tract Quantification and Their Correlations With Cognitive Impairment in Neuromyelitis Optica Spectrum Disorder Patients.Front Neurosci. 2022 Jul 1;16:904309. doi: 10.3389/fnins.2022.904309. eCollection 2022. Front Neurosci. 2022. PMID: 35844220 Free PMC article.
-
Microstructure abnormalities of the diffusion quantities in children with attention-deficit/hyperactivity disorder: an AFQ and TBSS study.Front Psychiatry. 2023 Aug 22;14:1237113. doi: 10.3389/fpsyt.2023.1237113. eCollection 2023. Front Psychiatry. 2023. PMID: 37674550 Free PMC article.
-
Glymphatic function assessment with diffusion tensor imaging along the perivascular space in patients with major depressive disorder and its relation to cerebral white-matter alteration.Quant Imaging Med Surg. 2024 Sep 1;14(9):6397-6412. doi: 10.21037/qims-24-510. Epub 2024 Aug 19. Quant Imaging Med Surg. 2024. PMID: 39281139 Free PMC article.
-
Fiber tracking: A qualitative and quantitative comparison between four different software tools on the reconstruction of major white matter tracts.Eur J Radiol Open. 2016 Jul 18;3:153-61. doi: 10.1016/j.ejro.2016.06.002. eCollection 2016. Eur J Radiol Open. 2016. PMID: 27489869 Free PMC article. Review.
References
-
- Ogurtsova K, da Rocha Fernandes JD, Huang Y, Linnenkamp U, Guariguata L, Cho NH, Cavan D, Shaw JE, Makaroff LE. IDF Diabetes Atlas: Global estimates for the prevalence of diabetes for 2015 and 2040. Diabetes Res Clin Pract 2017;128:40-50. - PubMed
-
- Sundstrom JM, Hernández C, Weber SR, Zhao Y, Dunklebarger M, Tiberti N, Laremore T, Simó-Servat O, Garcia-Ramirez M, Barber AJ, Gardner TW, Simó R. Proteomic Analysis of Early Diabetic Retinopathy Reveals Mediators of Neurodegenerative Brain Diseases. Invest Ophthalmol Vis Sci 2018;59:2264-74. - PMC - PubMed
LinkOut - more resources
Full Text Sources