. 2025 May 1;15(5):4592-4607.
doi: 10.21037/qims-24-2359. Epub 2025 Apr 28.

Quantitative assessment of biomechanical changes in oral lesions at different cancerous stages using optical coherence elastography

Affiliations

Quantitative assessment of biomechanical changes in oral lesions at different cancerous stages using optical coherence elastography

Yuhao Yang et al. Quant Imaging Med Surg. .

Abstract

Background: Oral cancer is the sixth most common cancer worldwide. The detection, prevention, and control of oral potentially malignant disorders (OPMDs) at early stages is imperative to reduce the incidence of oral cancer. This study analyzed ultrastructural and biomechanical tissue properties during tongue cancer development in Sprague-Dawley (SD) rats using optical coherence elastography (OCE). Our investigation examined the changes associated with oral cancer pathogenesis and explored the feasibility of OCE as an early diagnostic tool for oral cancer.

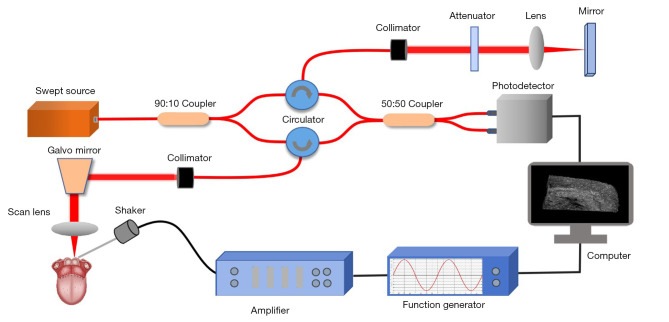
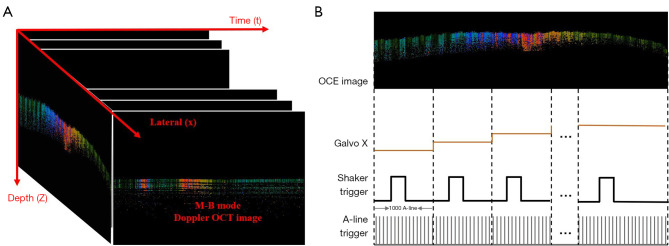
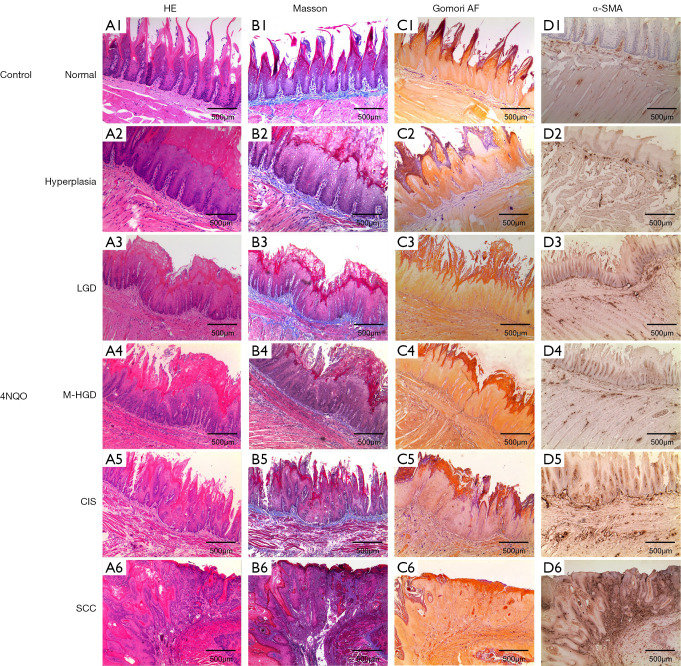
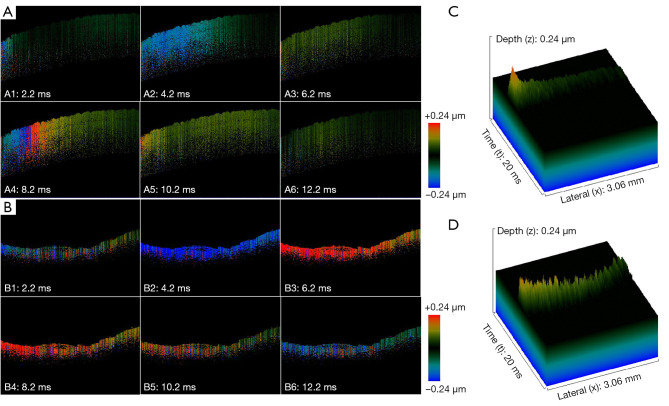
Methods: In this study, 4-nitroquinoline-1-oxide (4NQO) was used to induce oral carcinogenesis in SD rats. In total, 10 normal tissues, five hyperplastic lesions, eight low-grade dysplasias (LGDs), eight moderate-high-grade dysplasias (M-HGDs), seven carcinomas in situ (CISs), and seven squamous cell carcinomas (SCCs) were examined. The oral stroma changes were sequentially imaged by in vivo shaker-based OCE (shaker-OCE). The changes in the oral stroma from normal to hyperplasia, atypical hyperplasia, CIS, and cancer were determined using OCE, and histological findings such as extracellular matrix (ECM) components (including collagen and elastic fibers) and the expression of cancer-associated fibroblasts (CAFs) were compared at different stages of tongue cancer development.

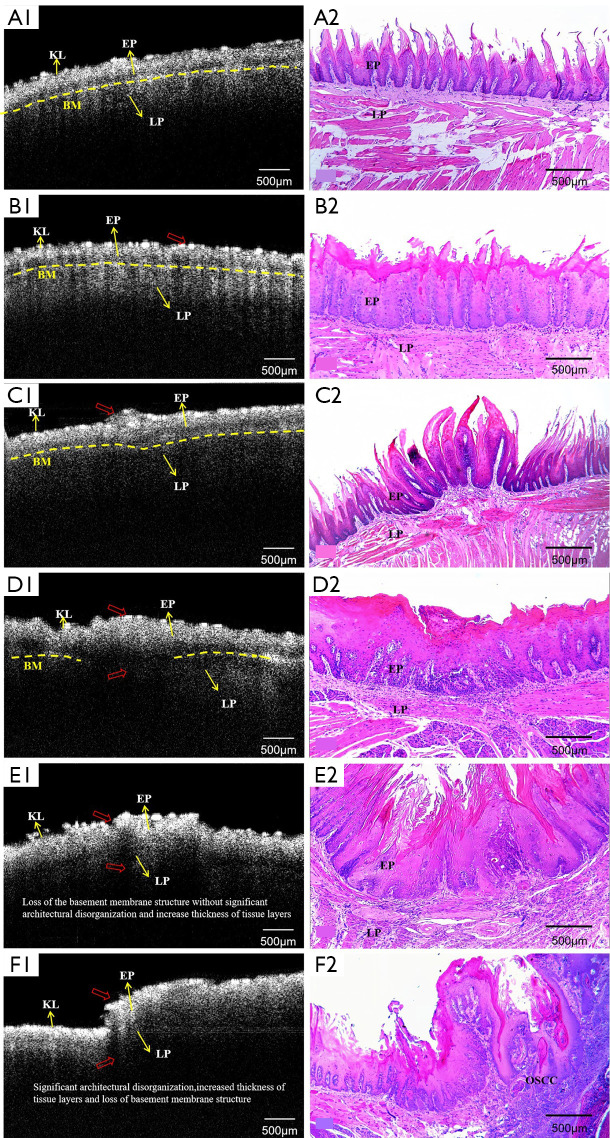
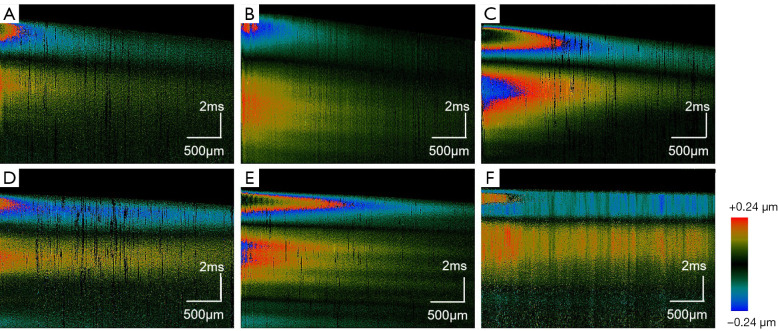
Results: The findings showed that OCE imaging could be used to accurately distinguish between normal, hyperplasia, atypical hyperplasia, CIS, and oral cancer. Additionally, there were significant differences in the tongue tissue biomechanics across the different lesion levels (P<0.05). Further, as the malignancy of the tongue cancer progressed in the SD rats, the level of collagen fibers gradually increased, showing a positive correlation (r=0.353, P<0.05), while the level of elastic fiber expression gradually decreased, showing a negative correlation (r=-0.776, P<0.05). The alpha-smooth muscle actin (α-SMA) scores of CIS and SCC were statistically significantly higher than those of normal, simple hyperplasia, mild atypical hyperplasia, and moderate-high atypical hyperplasia (P<0.05).

Conclusions: The ability of the shaker-OCE system to obtain the structural and biomechanical characteristics of tongue tissues in a non-invasive, real-time manner was confirmed by this study. It also showed notable benefits in terms of early diagnosis and the dynamic monitoring of tongue cancer. The systematic validation of the physiopathological model revealed a strong correlation between the elastic properties of cancerous tissues and pathological evolution, which provides a theoretical basis and experimental evidence for the clinical application of OCE technology.

Keywords: Oral cancer; dysplasia; early diagnosis; elasticity imaging techniques; optical coherence elastography (OCE).


Conflict of interest statement

Conflicts of Interest: All authors have completed the ICMJE uniform disclosure form (available at https://qims.amegroups.com/article/view/10.21037/qims-24-2359/coif). The authors have no conflicts of interest to declare.

Figures

Figure 1
Figure 1
Experimental protocol. (A) Experimental schedule, number of rats, and experimental results. (B) Sample excitation and OCE measurement procedures. Excitation (yellow) was performed at the uppermost position of the scan, and scanned along the propagation path (black). (Black arrows: inked potential tumor and histological sections). (C) Representative photographs of the tongues of 4NQO treated rats. 4NQO, 4-nitroquinoline-1-oxide; CIS, carcinoma in situ; LGD, low-grade dysplasia; M-HGD, moderate-high-grade dysplasia; OCE, optical coherence elastography; SCC, squamous cell carcinoma; wk, week.
Figure 2
Figure 2
Schematic of the shaker-OCE system. OCE, optical coherence elastography; shaker-OCE, shaker-based OCE.
Figure 3
Figure 3
Schematic diagram of M-scan mode. (A) Scan protocol of the M-B mode. (B) Timing diagram of the M-B mode. OCE, optical coherence elastography; OCT, optical coherence tomography.
Figure 4
Figure 4
HE, elastic fiber, collagenous fiber, and immunohistochemical staining during each progression stage of TSCC, and their correlations with (A1-D1) normal tongue mucosa, (A2-D2) hyperplastic tissues, (A3-D3) LGD, (A4-D4) M-HGD, (A5-D5) CIS, and (A6-D6) SCC. (A1-A6) HE staining; (B1-B6) Masson’s trichrome staining of collagenous fibers; (C1-C6) Gomori’s AF staining of elastic fibers; (D1-D6) immunohistochemical staining of α-SMA. α-SMA, alpha-smooth muscle actin; AF, aldehyde-fuchsin; CIS, carcinoma in situ; HE, hematoxylin and eosin; LGD, low-grade dysplasia; M-HGD, moderate-high-grade dysplasia; SCC, squamous cell carcinoma; TSCC, tongue squamous cell carcinoma.
Figure 5
Figure 5
OCT images and corresponding HE-stained histopathological images of different pathological stages of disease development, including (A1,A2) normal mucosa, (B1,B2) hyperplasia, (C1,C2) LGD, (D1,D2) M-HGD, (E1,E2) CIS, (F1,F2) SCC. The red arrows show the increase in epithelial thickness and the apparent loss of the regular layered structure of the oral mucosa with the increasing severity of tissue dysplasia. The yellow lines show the BM, which is the boundary between the EP and LP. BM, basement membrane; CIS, carcinoma in situ; EP, epithelial layer; HE, hematoxylin and eosin; KL, keratinized layer; LGD, low-grade dysplasia; LP, lamina propria; M-HGD, moderate-high-grade dysplasia; OCT, optical coherence tomography; OSCC, oral squamous cell carcinoma; SCC, squamous cell carcinoma.
Figure 6
Figure 6
Representative Doppler OCT B-scans and 3D images of shear propagation images. (A) Doppler OCT B-scans images of the control normal group at 2.2, 4.2, 6.2, 8.2, 10.2, and 12.2 ms. (B) Doppler OCT B-scan images of the carcinoma group at 2.2, 4.2, 6.2, 8.2, 10.2, and 12.2 ms. (C) 3D image of shear wave propagation in the phantom of the control normal group. (D) 3D image of shear wave propagation in the phantom of the cancer group. The scale bars in depth (z) are used to describe the tissue vibration depth induced by the excitation unit. 3D, three-dimensional; OCT, optical coherence tomography.
Figure 7
Figure 7
The corresponding spatiotemporal Doppler OCT images of the tongue tissue at different lesion stages: (A) normal, (B) hyperplasia, (C) LGD, (D) M-HGD, (E) CIS, and (F) SCC. CIS, carcinoma in situ; LGD, low-grade dysplasia; M-HGD, moderate-high-grade dysplasia; OCT, optical coherence tomography; SCC, squamous cell carcinoma.
Figure 8
Figure 8
The biomechanical properties of the tongue at different stages of pathology. (A) Averaged phase velocity for experiments at different lesion stages. (B) Box plot showing the biomechanical properties of the tongue at different lesion stages: the shear modulus and Young’s modulus values for experiments at different lesion stages (where the box is the inter-quartile range, and the central horizontal line is the median). Significant differences are indicated by different letters in the same group (P<0.05). Lowercase letters compare differences between the shear modulus groups, uppercase letters compare differences between the Young’s modulus groups. CIS, carcinoma in situ; LGD, low-grade dysplasia; M-HGD, moderate-high-grade dysplasia; SCC, squamous cell carcinoma.

Similar articles

References

    1. Noorlag R, Klein Nulent TJW, Delwel VEJ, Pameijer FA, Willems SM, de Bree R, van Es RJJ. Assessment of tumour depth in early tongue cancer: Accuracy of MRI and intraoral ultrasound. Oral Oncol 2020;110:104895. 10.1016/j.oraloncology.2020.104895 - DOI - PubMed
    1. Li J, Liang F, Yu D, Qing H, Yang Y. Development of a 4-nitroquinoline-1-oxide model of lymph node metastasis in oral squamous cell carcinoma. Oral Oncol 2013;49:299-305. 10.1016/j.oraloncology.2012.10.013 - DOI - PubMed
    1. Vered M, Allon I, Buchner A, Dayan D. Stromal myofibroblasts and malignant transformation in a 4NQO rat tongue carcinogenesis model. Oral Oncol 2007;43:999-1006. 10.1016/j.oraloncology.2006.11.007 - DOI - PubMed
    1. Chen PH, Wu CH, Chen YF, Yeh YC, Lin BH, Chang KW, Lai PY, Hou MC, Lu CL, Kuo WC. Combination of structural and vascular optical coherence tomography for differentiating oral lesions of mice in different carcinogenesis stages. Biomed Opt Express 2018;9:1461-76. 10.1364/BOE.9.001461 - DOI - PMC - PubMed
    1. Romano A, Di Stasio D, Petruzzi M, Fiori F, Lajolo C, Santarelli A, Lucchese A, Serpico R, Contaldo M. Noninvasive Imaging Methods to Improve the Diagnosis of Oral Carcinoma and Its Precursors: State of the Art and Proposal of a Three-Step Diagnostic Process. Cancers (Basel) 2021;13:2864. 10.3390/cancers13122864 - DOI - PMC - PubMed

LinkOut - more resources