

Mass Cytometry Analysis of High-Dimensional Single-Cell Immune Profiles in ZF2001-Vaccinated Patients Infected with SARS-CoV-2
- PMID: 40384795
- PMCID: PMC12085891
- DOI: 10.2147/IDR.S511936
Mass Cytometry Analysis of High-Dimensional Single-Cell Immune Profiles in ZF2001-Vaccinated Patients Infected with SARS-CoV-2
Abstract
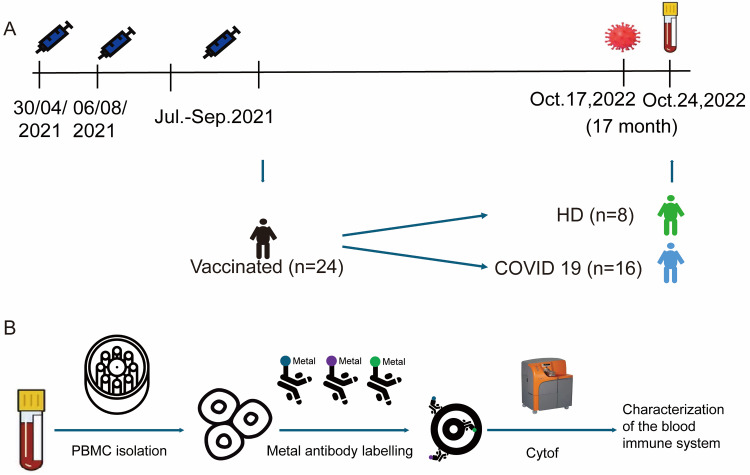
Introduction: Coronavirus disease 2019 (COVID-19), caused by the severe acute respiratory syndrome coronavirus 2 (SARS-CoV-2), was declared a public health emergency of international concern (PHEIC) by the WHO. ZF2001, a protein subunit vaccine targeting the RBD, was utilized to evaluate its impact on the immune system of COVID-19 patients. This study aimed to investigate peripheral cell profiles one year after three doses of ZF2001 vaccine using single cell mass spectrometry flow cytometry (CyTOF), a technique that allows detailed characterization of the immune response against SARS-COV-2 infection and further evaluation of ZF2001 mechanisms as a prophylactic against chronic disease and reducing mortality.
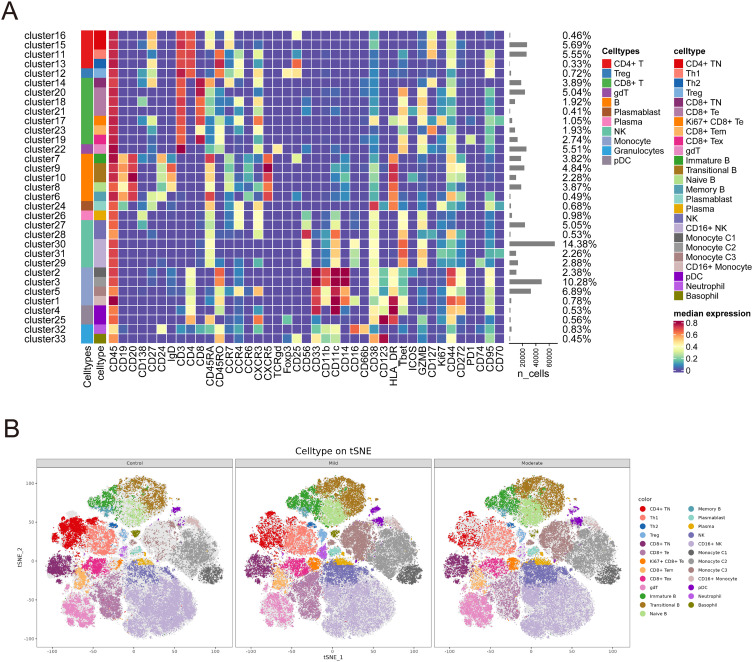
Methods: This study profiled peripheral blood mononuclear cells (PBMCs) from 16 vaccinated COVID-19 patients (Omicron 5.2) and 8 hDs using CyTOF with a 41-antibody panel. PBMCs isolated via Lymphoprep density gradient underwent metal-tagged antibody staining. Data analysis included FlowJo gating, Seurat/Harmony batch correction, PhenoGraph clustering (k=45), and t-SNE visualization. Statistical assessments employed Wilcoxon tests and Spearman correlation.
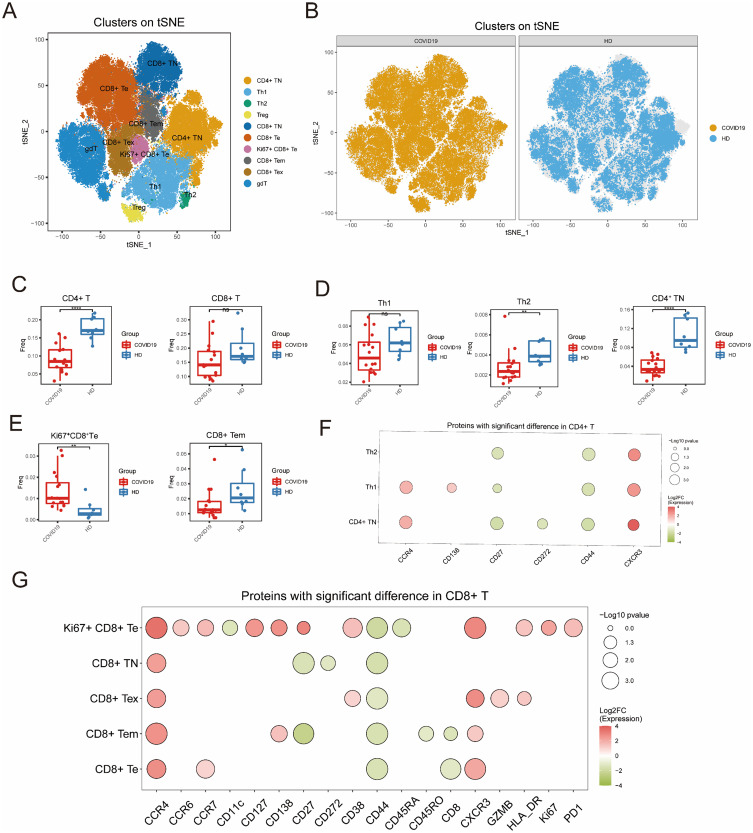
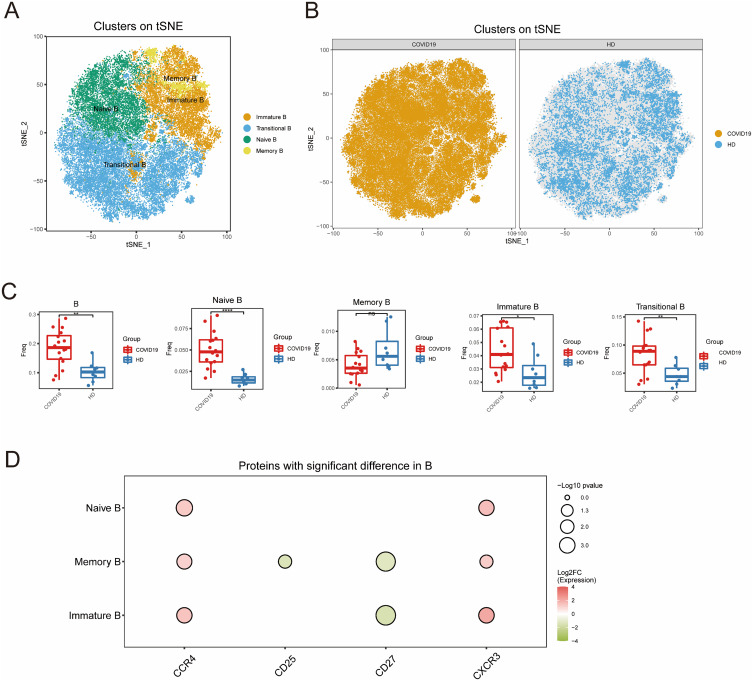
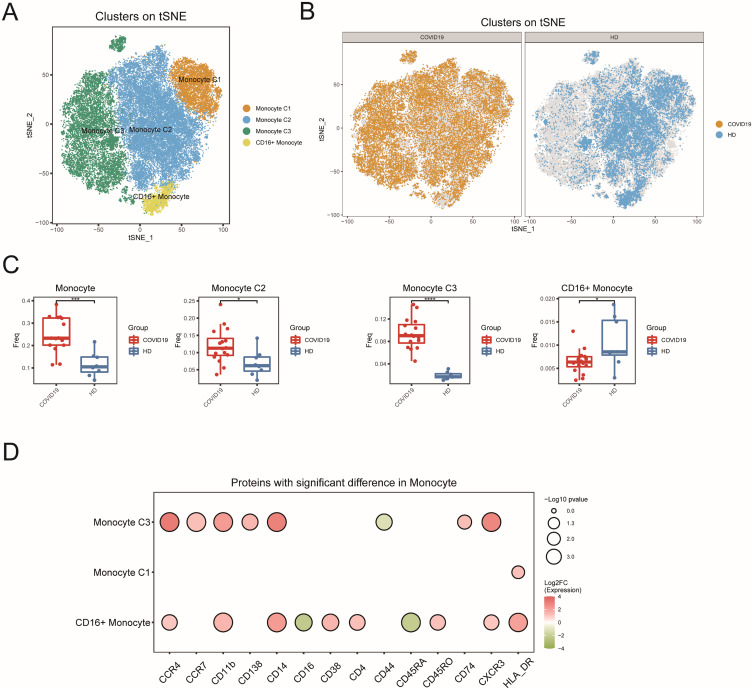
Results: Our findings revealed significant differences between infected and healthy individuals one year after three doses of ZF2001. Specifically, infected individuals exhibited: significant elevation of cytotoxic T cells expressing CD8 with a proliferation marker antigen-Kiel 67 (Ki67) and an adhesion molecule (CD138), expansion of B cells and reduction of monocytes expressing CD16, as well as depletion of CD4+ T cells and differentiation of T cells 1 year after the vaccine. These changes suggested that the vaccine was effectively modulating the immune response.
Discussion: Our results provided a detailed single-cell profile of the immune response to SARS-CoV-2 infection in vaccinated patients, highlighting significant changes in immune cell kinetics indicative of an active innate and adaptive immune cell response.
Keywords: COVID-19; CyTOF; ZF2001; immune response; vaccine.
© 2025 Zhang et al.
Conflict of interest statement
The authors report no conflicts of interest in this work.
Figures
Similar articles
-
Safety and immunogenicity of a protein subunit COVID-19 vaccine (ZF2001) in healthy children and adolescents aged 3-17 years in China: a randomised, double-blind, placebo-controlled, phase 1 trial and an open-label, non-randomised, non-inferiority, phase 2 trial.Lancet Child Adolesc Health. 2023 Apr;7(4):269-279. doi: 10.1016/S2352-4642(22)00376-5. Epub 2023 Feb 17. Lancet Child Adolesc Health. 2023. PMID: 36803632 Free PMC article. Clinical Trial.
-
Emerging Variants of SARS-CoV-2 and Novel Therapeutics Against Coronavirus (COVID-19).2023 May 8. In: StatPearls [Internet]. Treasure Island (FL): StatPearls Publishing; 2025 Jan–. 2023 May 8. In: StatPearls [Internet]. Treasure Island (FL): StatPearls Publishing; 2025 Jan–. PMID: 34033342 Free Books & Documents.
-
Repeated-dose toxicity and immunogenicity evaluation of a recombinant subunit COVID-19 vaccine (ZF2001) in rats.Front Cell Infect Microbiol. 2025 Apr 22;15:1548787. doi: 10.3389/fcimb.2025.1548787. eCollection 2025. Front Cell Infect Microbiol. 2025. PMID: 40330020 Free PMC article.
-
Safety and immunogenicity of heterologous boost immunization with an adenovirus type-5-vectored and protein-subunit-based COVID-19 vaccine (Convidecia/ZF2001): A randomized, observer-blinded, placebo-controlled trial.PLoS Med. 2022 May 26;19(5):e1003953. doi: 10.1371/journal.pmed.1003953. eCollection 2022 May. PLoS Med. 2022. PMID: 35617368 Free PMC article. Clinical Trial.
-
Omicron BA.1-specific T-cell responses in adults vaccinated with CoronaVac or BNT162b2 in Hong Kong: an observational cohort study.Lancet Microbe. 2023 Jun;4(6):e418-e430. doi: 10.1016/S2666-5247(23)00006-X. Epub 2023 Apr 20. Lancet Microbe. 2023. PMID: 37086735 Free PMC article.
References
-
- Omotayo O, Muonde M, Olorunsogo TO, Ogugua JO, Maduka CP. Pandemic epidemiology: a comprehensive review of covid-19 lessons and future healthcare preparedness. IMSRJ. 2024;4(1):89–107. doi:10.51594/imsrj.v4i1.739 - DOI
-
- Al-Sheboul SA, Brown B, Shboul Y, Fricke I, Imarogbe C, Alzoubi KH. An immunological review of SARS-CoV-2 infection and vaccine serology: innate and adaptive responses to mRNA, adenovirus, inactivated and protein subunit vaccines. Vaccines. 2023;11(1):51. doi:10.3390/vaccines11010051 - DOI - PMC - PubMed
LinkOut - more resources
Full Text Sources
Research Materials
Miscellaneous
