. 2025 Apr 22;21(7):3045-3060.
doi: 10.7150/ijbs.98653. eCollection 2025.

The Therapeutic Potential of EGCG and Pro-EGCG in Mitigating Ovarian Hyperstimulation Syndrome: Unraveling the Modulatory Mechanism through the VEGF Pathway

Affiliations

The Therapeutic Potential of EGCG and Pro-EGCG in Mitigating Ovarian Hyperstimulation Syndrome: Unraveling the Modulatory Mechanism through the VEGF Pathway

Sijia Wang et al. Int J Biol Sci. .

Abstract

Ovarian hyperstimulation syndrome (OHSS) is a severe complication of controlled ovarian hyperstimulation (COH) during in vitro fertilization (IVF) treatment, characterized by increased capillary permeability. Vascular endothelial growth factor (VEGF) is a key mediator in OHSS, with serum VEGF levels correlating with its severity. In this study, we investigated the therapeutic potential of (-)-epigallocatechin-3-gallate (EGCG) and its derivative, Pro-EGCG, in mitigating OHSS. Using both in vitro and in vivo models, including primary human granulosa-lutein cells, the human granulosa-like tumor KGN cell line, and a rat OHSS model induced with pregnant mare serum gonadotropin, we found that EGCG and Pro-EGCG significantly reduced OHSS progression. This was supported by histological analyses, reductions in ovarian weight, and decreased VEGF expression at both transcriptomic and proteomic levels. Mechanistic studies revealed that EGCG and Pro-EGCG inhibit TGF-β-induced VEGF production through suppression of the TGF-β/Smad and PKA-CREB signaling pathways. RNA sequencing further validated the downregulation of VEGF expression following treatment. These findings highlight the potential of EGCG as a novel adjuvant therapy for managing OHSS, providing a mechanistic basis for its clinical application.

Keywords: EGCG; OHSS; OHSS animal model; RNA-Seq; VEGF pathway.


Conflict of interest statement

Competing interests: The authors have declared that no competing interest exists.

Figures
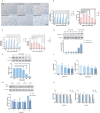
Figure 1
Figure 1
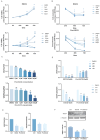
EGCG inhibits VEGF expression. (A) KGN cells were treated with vehicle control (DMSO) or various concentrations of EGCG (1 µM, 5 µM, 10 µM, 25 µM, and 50 µM) for 24 h, and cellular morphology was observed microscopically. (B, C) Cell viability (B) and proliferation (C) were evaluated via MTT assay and cell counting, respectively, following treatment with DMSO or EGCG at the indicated concentrations for 24, 48, and 72 h. (D) Western blot analysis of caspase-3 protein levels in KGN cells treated with DMSO or EGCG (5 µM, 10 µM, 25 µM, and 50 µM) for 24 h. Etoposide (50 µM and 100 µM) was included as a positive control. (E, F) VEGF protein expression (E) and VEGF/VEGFR-2 mRNA levels (F) were determined by western blot and RT-qPCR, respectively, in KGN cells treated with DMSO or EGCG at the specified concentrations for 24 h. (G, H) Time-course experiments were conducted to assess VEGF protein expression (G) and VEGF/VEGFR-2 mRNA levels (H). KGN cells were treated with DMSO or 25 µM EGCG for 3, 6, 12, and 24 h (G) or for 1, 3, 6, 12, and 24 h (H). Results are presented as the mean ± SEM from at least three independent experiments. Significant differences are denoted by asterisks (*p < 0.05, **p < 0.01).
Figure 2
Figure 2
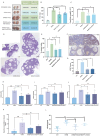
67LR-mediated PKA-CREB activation is required for EGCG-induced reduction in VEGF expression. (A) KGN cells were transfected with 50 nM control siRNA (si-Ctrl) or 67LR siRNA (si-67LR) for 48 h, followed by treatment with 25 µM EGCG for 24 h. Protein levels of VEGF, 67-kDa laminin receptor (67LR), and α-Tubulin were analyzed by western blot. (B) Phosphorylated and total CREB protein levels were assessed via western blot in KGN cells treated with 25 µM EGCG for 30 or 60 min. (C) KGN cells were transfected with 50 nM si-Ctrl or si-67LR for 48 h and then exposed to 25 µM EGCG for 30 min. Protein levels of phosphorylated and total CREB, along with 67LR, were examined by western blot. (D) KGN cells were pre-treated with vehicle control (DMSO) or 1 µM H89 for 1 h before treatment with 25 µM EGCG for 24 h. Protein levels of VEGF and α-Tubulin were measured via western blot. (E) KGN cells were transfected with 50 nM si-Ctrl or CREB siRNA (si-CREB) for 48 h, followed by treatment with 25 µM EGCG for 24 h. Western blot analysis was performed to evaluate protein levels of VEGF, CREB, and α-Tubulin. (F) Phosphorylated and total CREB protein levels were evaluated by western blot in KGN cells pre-treated with DMSO or 1 µM H89 for 1 h, followed by treatment with 25 µM EGCG for 30 min. Results are presented as the mean ± SEM from at least three independent experiments. Significant changes are indicated by asterisks (*p < 0.05, **p < 0.01).
Figure 3
Figure 3
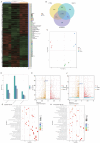
EGCG inhibits VEGF expression via TGF-β signaling pathways. (A) Molecular docking analysis demonstrates the interaction between EGCG and TGF-β receptor type II (TβRII). (B) KGN cells were pre-treated with vehicle control (DMSO), 10 µM EGCG, or 25 µM EGCG for 24 h, followed by stimulation with 5 ng/mL TGF-β for 3 h. VEGF and α-Tubulin protein levels were analyzed by western blot (left panel). VEGF mRNA levels were determined by western blot and RT-qPCR (right panel). (C) KGN cells were pre-treated with DMSO or 25 µM EGCG for 24 h, then treated with 5 ng/mL TGF-β for 30 min. Western blot analysis was performed to assess phosphorylated and total SMAD2 protein levels, with α-Tubulin serving as a loading control. (D) Phosphorylated and total SMAD3 protein levels were also analyzed under the same conditions using western blot. (E) KGN cells were transfected with 50 nM control siRNA (si-Ctrl) or SMAD4 siRNA (si-SMAD4) for 48 h, followed by exposure to 25 µM EGCG for 30 min. Protein levels of VEGF, SMAD4, and α-Tubulin were evaluated by western blot. Results are presented as the mean ± SEM of at least three independent experiments. Significant differences are indicated by asterisks (*p < 0.05, **p < 0.01).
Figure 4
Figure 4
EGCG and Pro-EGCG exhibit similar cytotoxic effects and effectively reduce VEGF and VEGFR-2 expression. (A) KGN cells were treated with vehicle control (DMSO) or varying concentrations of EGCG (upper panel) or Pro-EGCG (lower panel) for 0, 24, 48, and 72 h. Cell viability was assessed using the MTT assay. (B) Cytotoxicity was further evaluated under the same conditions as in (A) using the MTT assay. (C) KGN cells were treated with DMSO or different concentrations of Pro-EGCG for 24 h, and VEGF and VEGFR-2 mRNA levels were quantified by RT-qPCR. (D) KGN cells were exposed to DMSO, 10 µM EGCG, or 10 µM Pro-EGCG for 24, 48, and 72 h. VEGF and VEGFR-2 mRNA levels were analyzed by RT-qPCR. (E) Primary hGL cells were treated with DMSO, 10 µM EGCG, or 10 µM Pro-EGCG for 24 h, and VEGF and VEGFR-2 mRNA levels were determined by RT-qPCR. (F) Protein levels of VEGF in primary hGL cells were examined by western blot after treatment with DMSO, 10 µM EGCG, or 10 µM Pro-EGCG. Results are presented as the mean ± SEM from at least three independent experiments. Significant differences are denoted by asterisks (*p < 0.05, **p < 0.01).
Figure 5
Figure 5
EGCG and Pro-EGCG alleviate OHSS development in rats. (A) Representative images of ovaries from each experimental group. (B, C) Ovarian weight (B) and ovarian weight normalized to body weight (C) were measured after euthanasia. (D) Representative H&E-stained ovarian sections. Images were captured at 400× magnification; scale bars represent 50 μm. (E) Percentage of corpora lutea in ovarian sections was quantified (n = 4 per group). (F) Representative IHC staining of ovarian tissues for VEGF, with images captured at 400× magnification; scale bars represent 50 μm. (G) Quantitative analysis of VEGF protein expression in ovarian tissues based on IHC staining. VEGF expression was evaluated as positive staining intensity. (H-J) mRNA levels of VEGF (H), VEGFR-2 (I), and TGF-β (J) in rat ovaries were quantified by RT-qPCR. (K) Levels of Evans Blue dye in peritoneal fluid were measured at OD620 nm across different groups. (L) Serum VEGF protein levels were quantified using ELISA. Results are presented as the mean ± SEM from at least three independent experiments. Significant differences are indicated by asterisks (*p < 0.05, **p < 0.01).
Figure 6
Figure 6
RNA-sequencing results in KGN cells treated with EGCG and Pro-EGCG. (A) Heatmap displaying the top 200 most upregulated and downregulated genes. (B) Venn diagram illustrating co-expression of genes across different treatment groups. (C) Principal component analysis (PCA) of all samples to visualize variance and clustering. (D) Bar chart showing the number of differentially expressed genes (DEGs) in each group comparison. (E) Volcano plot depicting gene expression differences between EGCG-treated and control cells. (F) Volcano plot showing gene expression differences between Pro-EGCG-treated and control cells. (G) GO (Gene Ontology) enrichment analysis scatter plot for EGCG-treated versus control cells, highlighting GO terms with significant enrichment (padj < 0.05). (H) GO enrichment analysis scatter plot for Pro-EGCG-treated versus control cells, showing significantly enriched GO terms (padj < 0.05).

References

    1. Kumar P, Sait SF, Sharma A, Kumar M. Ovarian hyperstimulation syndrome. Journal of human reproductive sciences. 2011;4:70. - PMC - PubMed
    1. Nastri C, Teixeira D, Moroni R, Leitão V, Martins WdP. Ovarian hyperstimulation syndrome: pathophysiology, staging, prediction and prevention. Ultrasound in Obstetrics & Gynecology. 2015;45:377–93. - PubMed
    1. Delvigne A, Rozenberg S. Epidemiology and prevention of ovarian hyperstimulation syndrome (OHSS): a review. Human reproduction update. 2002;8:559–77. - PubMed
    1. Whelan III JG, Vlahos NF. The ovarian hyperstimulation syndrome. Fertility and sterility. 2000;73:883–96. - PubMed
    1. Medicine PCotASfR. Ovarian hyperstimulation syndrome. Fertility and sterility. 2008;90:S188–S93. - PubMed

MeSH terms

Substances

LinkOut - more resources