. 2025 Apr 22;21(7):3061-3080.
doi: 10.7150/ijbs.111128. eCollection 2025.

Macrophage-derived S100A9 promotes diabetic cardiomyopathy by disturbing mitochondrial quality control via STAT3 activation

Affiliations

Macrophage-derived S100A9 promotes diabetic cardiomyopathy by disturbing mitochondrial quality control via STAT3 activation

Shengqi Huo et al. Int J Biol Sci. .

Abstract

The macrophage-cardiomyocyte crosstalk as a potential intervention target for diabetic cardiomyopathy (DCM) remains deeper exploration. We found S100A9, as an immunoinflammatory mediator, was up-regulated in cardiomyocytes and macrophages in diabetic heart by single-cell analysis. Furthermore, F4/80+CCR2+S100A9+ macrophages in peripheral blood and heart both increased in diabetic mice. S100A9 blocking by paquinimod or macrophage depletion (clodronate) alleviated diabetes-induced cardiac dysfunction, inflammatory macrophage infiltration, serum pro-inflammatory cytokines. More importantly, diabetic cardiac dysfunction, myocardial remodeling, and inflammation could be suppressed by macrophage specific S100A9 knockout (S100a9flox/floxLyz2-Cre). S100A9 activation led to excessive mitochondrial fission, decreased mitophagy flux, and elevated mitochondrial oxidative stress. In addition, proteomics and transcription factor profiling array unveiled S100A9 activated STAT3 in cardiomyocytes. Nevertheless, these effects were mitigated by STAT3(Y705F) mutation, STAT3 knockdown, or paquinimod. Our study highlights macrophage-derived S100A9 as a critical mediator for impaired mitochondrial quality control in diabetic cardiac dysfunction, and targeting S100A9 represents a promising therapeutic target.

Keywords: S100A9; STAT3; diabetic cardiomyopathy; macrophage; mitochondrial quality control.


Conflict of interest statement

Competing Interests: The authors have declared that no competing interest exists.

Figures
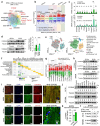
Figure 1
Figure 1
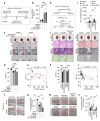
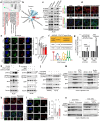
S100A9 is upregulated in diabetic heart. a-b, Venn plot and volcano plot of multiple RNA-seq datasets of diabetic heart in GEO database. c, mRNA expression of differentially expressed genes (DEGs) in diabetic heart (n=5). d, S100A9 protein expression in diabetic heart (n=5). Tubulin was used as a loading control. e, tSNE plot of single-cell RNA sequencing dataset (GSE213337). f, Dot plot of cell-specific markers. g, Volcano plot of DEGs in different cell types. h, S100A9 protein expression in primary cardiomyocytes and macrophages (BMDM) of diabetic mice (n=3). i, Immunofluorescence staining of diabetic mouse heart tissues for S100A9 (green), α-actinin (red) or CD11b (red). (Scale bar=50 μm, or 10 μm in ZOOM picture). j, S100A9 protein expression in cardiomyocytes (AC16 cells, NRVMs) induced by multiple inducing factors. k, S100A9 concentration in BMDM cultured supernatant of diabetic mice (n=5). l, S100A9 protein expression in AC16 and NRVMs cultured with conditional BMDM supernatant of diabetic mice. *p < 0.05, **p < 0.01, ***p < 0.001. All data are presented as mean ± SD, and statistical significance was determined by unpaired student's t-test. Neonatal rat ventricular cardiomyocytes, NRVMs. Bone marrow-derived macrophages, BMDM. High glucose, HG. Palmitic acid, PA. Advanced glycation endproducts, AGE.
Figure 2
Figure 2
S100A9 aggravates cardiac dysfunction in diabetic mice and be alleviated by S100A9 blockade. a, Schematic experimental procedure of AAV9-cTNT-S100A9 overexpression in cardiomyocytes of diabetic mice heart. b, Serum S100A9 concentration (n=6) in S100A9-overexpressed diabetic mice. c, Heart morphology (Scale bar=2 mm), HE (Scale bar=100 μm), Masson-trichrome (Scale bar=100 μm), and Sirius red (Scale bar=100 μm) staining in S100A9-overexpressed mice. d, Cardiac function of LVEF in S100A9-overexpressed diabetic mice (n=6). e, Scatter diagram of the correlation between LVEF (%) and serum S100A9 (pg/mL). f, Transmission electron microscopy (Scale bar=2 μm) images. g, ATP content of diabetic myocardial tissues (n=5). h, Schematic experimental procedure of S100A9 blockade by paquinimod (PAQ) in diabetic mice. i, Serum S100A9 concentration (n=7, STZ group; n=9, db/db group). j, Heart morphology (Scale bar=2 mm), HE (Scale bar=50 μm), Masson-trichrome (Scale bar=50 μm), and Sirius red (Scale bar=50 μm) staining in STZ+HFD and db/db mice. k, Cardiac function of LVEF in diabetic mice with PAQ administration (n=9, STZ group; n=11, db/db group). l, Scatter diagram of the correlation between LVEF (%) and serum S100A9 (pg/mL) in diabetic mice with PAQ administration. m, Transmission electron microscopy (Scale bar=2 μm) images in diabetic mice with PAQ administration. n, ATP content of diabetic myocardial tissues (n=7) with PAQ administration. *p < 0.05, **p < 0.01, ***p < 0.001. All data are presented as mean ± SD. Statistical significance was determined by one-way ANOVA.
Figure 3
Figure 3
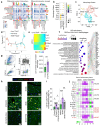
Macrophage-cardiomyocyte crosstalk and inflammation increase in diabetic mice. a, Interaction numbers and strength between cell types of scRNA-seq (GSE213337). b, Specific markers used for macrophage re-clustering. c, Macrophages were re-clustered into three subsets. d, The pseudotime distribution of macrophage subtypes by Monocle. e, Heatmaps represent the dynamic expression of genes between the Lyve1+Folr2+ and Il1b+Ccr2+ clusters. f, GO enrichment of DEGs of Il1b+Ccr2+ cluster. g, Flow cytometry plot showing the gating strategy of macrophage in the peripheral blood of diabetic mice, and the percentage of CD11b+F4/80+CCR2+ macrophage in diabetic mice (n=6). h, Immunofluorescence staining of diabetic mouse heart for S100A9 (green), F4/80 (red) or CCR2 (violet). (Scale bar=20 μm). i, The percentage of CD11b+Ly6ChighCCR2+ monocyte/macrophage in diabetic mice (n=8, STZ group; n=10, db/db group). j, Serum inflammatory factors levels in db/db mice (n=3 per group). *p < 0.05, **p < 0.01, ***p < 0.001. All data are presented as mean ± SD. Statistical significance was determined by one-way ANOVA.
Figure 4
Figure 4
Macrophage depletion by clodronate liposomes ameliorates cardiac dysfunction in diabetic mice. a, Schematic experimental procedure of macrophage depletion by clodronate liposomes in diabetic mice. b, Flow cytometry plot showing the gating strategy of macrophage in the peripheral blood of diabetic mice. c-d, The percentage of CD11b+F4/80+ macrophage and CD11b+F4/80+CCR2+S100A9+ macrophage (n=7). e, Immunofluorescence staining for S100A9 (green) and macrophage marker CD80 (red). (Scale bar=10 μm). f, Serum S100A9 concentration (n=6). g, Cardiac function of LVEF in diabetic mice before and after macrophage depletion (n=6). h, Scatter diagram of the correlation between LVEF (%) and serum S100A9 (pg/mL). i, ATP content of diabetic myocardial tissues with macrophage depletion (n=5). j, Heart morphology (Scale bar=2 mm), HE (Scale bar=20 μm), Masson-trichrome (Scale bar=50 μm), and Sirius red (Scale bar=50 μm) staining. k, Immunofluorescence staining of diabetic mouse heart for S100A9 (green), F4/80 (red) or CCR2 (violet). (Scale bar=20 μm). l, Serum inflammatory factors levels in diabetic mice with macrophage depletion (n=3 per group). *p < 0.05, **p < 0.01, ***p < 0.001. All data are presented as mean ± SD, and statistical significance was determined by unpaired student's t-test.
Figure 5
Figure 5
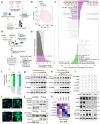
Macrophage-specific S100A9 conditional knockout ameliorates cardiac dysfunction in diabetic mice. a, Schematic experimental procedure of macrophage-specific S100A9 conditional knockout (S100a9flox/floxLyz2-Cre) in diabetic mice. b-c, Flow cytometry plot showing the gating strategy and the percentage of CD11b+S100A9+ myeloid cells in the peripheral blood of diabetic mice (n=6). d, Serum S100A9 concentration (n=6). e-f, S100a9 mRNA and protein expression in BMDM of diabetic mice (n=5). g, Cardiac function of LVEF in diabetic mice with macrophage-specific S100A9 knockout (n=6). h, Scatter diagram of the correlation between LVEF (%) and serum S100A9 (pg/mL). i, ATP content of diabetic myocardial tissues (n=5). j, Heart morphology (Scale bar=2 mm), HE (Scale bar=20 μm), Masson-trichrome (Scale bar=50 μm), and Sirius red (Scale bar=50 μm) staining. k, Immunofluorescence staining of diabetic mouse heart for S100A9 (green), F4/80 (red) or CCR2 (violet). (Scale bar=20 μm). l, Serum inflammatory factors levels in diabetic mice with macrophage-specific S100A9 knockout (n=3 per group). *p < 0.05, **p < 0.01, ***p < 0.001. All data are presented as mean ± SD, and statistical significance was determined by unpaired student's t-test. Bone marrow-derived macrophages, BMDM.
Figure 6
Figure 6
S100A9 activates STAT3 in cardiomyocytes. a, DIA-proteomics was performed in AC16 cardiomyocytes exposed to rhS100A9 (2 μg/mL, 24 hours). b, PCA plot of proteomics. c, GSVA analysis of proteomics. d, Workflow for TF promoter-binding profiling plate array in AC16 cardiomyocytes exposed to rhS100A9 (2 μg/mL, 24 hours). e, Bar chart of rhS100A9-induced transcription factors (TF) activation in AC16 cardiomyocytes. f, STAT3 mRNA expression in AC16 cardiomyocytes induced by rhS100A9 or S100A9 overexpression. g, AC16 cells were exposed to concentration gradient of rhS100A9 (0, 0.5, 1, 2, 4, 6 μg/mL) for 24 hours. Representative blots showing the levels of S100A9, STAT3, and phosphorylation of STAT3 (Tyr705). Tubulin was used as a loading control. h, AC16 was transfected with a concentration gradient of pcDNA3.1(+)-Flag-S100A9 plasmid (0, 0.3125, 0.625, 1.25, 2.5, 5 μg DNA) or empty vector plasmid for 48 hours. Representative blots showing the levels of S100A9, STAT3, and pSTAT3 (Tyr705). Tubulin was used as a loading control. i, Immunofluorescence of pSTAT3 (Tyr705) in AC16 cells (Scale bar = 20 μm). j, Nuclear fraction of AC16 cells with rhS100A9 exposure or S100A9 overexpression was separated. Western blots detected pSTAT3 (Tyr705). Lamin B and Tubulin were used as nuclear and cytoplasmic markers, respectively. k, IL6, IL6R, IL6ST, JAK2, and STAT3 mRNA level in AC16 cells after siRNA transfection. l, Representative blots showing the levels of IL6, IL6R, IL6ST, JAK2, STAT3 and pSTAT3 (Tyr705) in AC16 cardiomyocytes with siRNA transfection and/or rhS100A9 incubation. Tubulin was used as a loading control. All data are presented as mean ± SD. Statistical significance was determined by unpaired student's t-test.
Figure 7
Figure 7
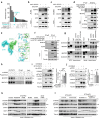
S100A9 promotes STIP1-STAT3 interaction in cardiomyocytes and diabetic heart tissues. a, Upset-Venn plot of IP-MS results in rhS100A9-treated AC16 cardiomyocytes. b-c, co-immunoprecipitation (co-IP) of MYC-STAT3 and HA-STIP1 in AC16 cardiomyocytes. d, S100A9 promoted STIP1 binding with STAT3 in AC16 cells transfected with Flag-S100A9, MYC-STAT3 and HA-STIP1. e, The predicted binding sites between STIP1 and STAT3. Optimized pose model of STIP1-STAT3 interaction by R-Dock analysis. f, Full-length STIP1 or truncated mutant STIP1 (TPR5-8 domain, Δ259-427) were co-transfected with MYC-STAT3 in AC16 cardiomyocytes. co-IP of STAT3 and STIP1 was perform with HA-tag antibody. g, co-IP of STAT3 and STIP1 was performed in STZ-induced or db/db diabetic heart tissues treated with/without paquinimod (PAQ). h, co-IP of STAT3 and STIP1 in AC16 cardiomyocytes incubated with rhS100A9 and paquinimod. i, Representative blots showing the levels of pSTAT3(Tyr705) in AC16 cells with STAT3 and STIP1 overexpression and/or rhS100A9 exposure (n=3). j, Representative blots showing the levels of pSTAT3(Tyr705) in AC16 cells with STIP1 knockdown and/or rhS100A9 exposure (n=3). k, Representative blots showing the protein expression of S100A9, pSTAT3 (Tyr705), STAT3, and STIP1 in STZ-induced or db/db diabetic heart tissues treated with/without paquinimod (PAQ) (n=4). Tubulin was used as a loading control. l, Representative blots showing the S100A9, pSTAT3 (Tyr705), STAT3, and STIP1 protein expression in heart tissues of diabetic mice with macrophage depletion or macrophage-specific S100A9 conditional knockout (n=6 per group). Tubulin was used as a loading control. *p < 0.05, **p < 0.01, ***p < 0.001. All data are presented as mean ± SD. Statistical significance was determined by one-way ANOVA.
Figure 8
Figure 8
S100A9 promotes excessive mitochondrial fission and inhibits mitophagy flux in cardiomyocytes. a, GO enrichment of up-regulated DEGs in cardiomyocytes of scRNA-seq (GSE213337). b, Subcellular localization of the identified differentially expressed proteins by proteomics in AC16 cells exposed to rhS100A9. c, Protein expression of S100A9, pSTAT3 (Tyr705), STAT3, pDRP1 (Ser616), DRP1, FIS1, and MFF in AC16 cells with S100A9 overexpression or rhS100A9 exposure. d, Mito-Tracker, MitoSOX and JC-1 staining in AC16 cardiomyocytes exposed to high glucose (HG) and/or rhS100A9 (Scale bar=10 μm or 50 μm). e, Mt-Keima staining and the ratio of 550nm/440nm fluorescence intensity (n=13) detected by microplate reader in AC16 cardiomyocytes exposed to high glucose and/or rhS100A9 (Scale bar=10 μm). f, Target genes of STAT3 predicted by JASPAR database. g, Dual-luciferase reporter assay. h, Representative blots showing the levels of STAT3, pSTAT3 (Tyr705), MFF, and FIS1 in AC16 cells overexpressed with wild-type STAT3 (WT) or mutant STAT3 (Y705F). i, Representative blots showing the levels of pSTAT3 (Tyr705), STAT3, MFF, and FIS1 in AC16 cells with STAT3 knockdown and/or rhS100A9 exposure. j, Representative blots showing the levels of pSTAT3 (Tyr705), MFF, and FIS1 in NRVMs and AC16 cardiomyocytes with rhS100A9 and/or paquinimod exposure (20μM, 24 hours). k, Mito-Tracker, MitoSOX and JC-1 staining in AC16 cardiomyocytes treated with rhS100A9 and/or paquinimod (Scale bar = 10 μm or 50 μm). l, Mt-Keima staining and the ratio of 550nm/440nm fluorescence intensity (n=8) detected by microplate reader in AC16 cardiomyocytes exposed to rhS100A9 and/or paquinimod. m, Representative blots showing the protein expression of pDRP1 (Ser616), DRP1, FIS1 and MFF in STZ-induced or db/db diabetic heart tissues treated with/without paquinimod (PAQ) (n=4). n, Representative blots showing the pDRP1 (Ser616), FIS1 and MFF protein expression in heart tissues of diabetic mice with macrophage depletion or macrophage-specific S100A9 conditional knockout (n=6 per group). *p < 0.05, **p < 0.01, ***p < 0.001. All data are presented as mean ± SD. Statistical significance was determined by one-way ANOVA (e, l), or two-way ANOVA (g).

References

    1. Collaboration NCDRF. Worldwide trends in diabetes prevalence and treatment from 1990 to 2022: a pooled analysis of 1108 population-representative studies with 141 million participants. Lancet. 2024;404(10467):2077–93. - PMC - PubMed
    1. Dillmann WH. Diabetic Cardiomyopathy. Circ Res. 2019;124(8):1160–2. - PMC - PubMed
    1. Ritchie RH, Abel ED. Basic Mechanisms of Diabetic Heart Disease. Circ Res. 2020;126(11):1501–25. - PMC - PubMed
    1. Xu H, Chen M, Forrester JV. Para-inflammation in the aging retina. Prog Retin Eye Res. 2009;28(5):348–68. - PubMed
    1. Zhou B, Wang DD, Qiu Y, Airhart S, Liu Y, Stempien-Otero A. et al. Boosting NAD level suppresses inflammatory activation of PBMCs in heart failure. J Clin Invest. 2020;130(11):6054–63. - PMC - PubMed