. 2025 Apr 28;21(7):3286-3305.
doi: 10.7150/ijbs.109642. eCollection 2025.

Microtubule dynamics is a therapeutic vulnerability in VHL-deficient renal cell carcinoma

Affiliations

Microtubule dynamics is a therapeutic vulnerability in VHL-deficient renal cell carcinoma

Yue Pu et al. Int J Biol Sci. .

Abstract

Von Hippel-Lindau (VHL) is a tumor suppressor frequently mutated in renal cell carcinoma (RCC) and its loss has been considered as a target for therapeutic exploitation. In an effort to identify therapeutic vulnerabilities in VHL-deficient RCC, we found that SKPin C1, a SKP2 inhibitor, exhibited synthetic lethal effects on VHL-deficient RCC cells. SKPin C1 selectively disrupted spindle assembly in VHL-deficient RCC, leading to the induction of mitotic arrest and death. These effects were independent of its inhibitory action on SKP2. Our in-depth biochemical and molecular interaction studies reveal that SKPin C1 binds to tubulin and inhibits microtubule polymerization. Interestingly, anti-microtubule effect of SKPin C1 was much more pronounced in VHL-deficient RCC cells. Further mechanistic studies on the synthetic lethality reveal that VHL loss alters microtubule dynamics in cells, promoting microtubule growth speed while reducing stability. Treatment of VHL-deficient RCC cells with SKPin C1 or other microtubule destabilizers strongly suppressed microtubule growth and reduced the levels of GTP-tubulin and acetylated microtubules, resulting in selective vulnerability in VHL-deficient RCC. Taken together, our study suggests that microtubule dynamics is a therapeutic vulnerability in VHL-deficient RCC and provides a rationale for the combination treatment of VHL-deficient RCC with anti-microtubule agents and RCC targeted therapies.

Keywords: VHL; drug target; microtubule; renal cell carcinoma; synthetic lethality.


Conflict of interest statement

Competing Interests: The authors have declared that no competing interest exists.

Figures

Figure 1
Figure 1
SKPin C1 induced synthetic lethality in VHL-deficient RCC cells in a SKP2-independent manner. A Verification of VHL-isogenic RCC cell line. Western blotting analysis of VHL, HA tag and its downstream target genes HIF-2α, VEGF, GLUT1 expression in VHL-isogenic RCC cell line. Data are shown as the mean ± SD, n=3. B Schematic illustration of highly selective inhibitor library screening for synthetic lethality. VHL-isogenic RCC cell pairs were parallelly seeded and treated with 318 selective inhibitors with 8-dose in 384-well plates, after 72 hours incubation, the cell viability was detected by alarm blue assay and analyzed the IC50 to identify the potential hits. C Dose response curve of 786-O VHL-isogenic cell pair treated with 2-DG- for 72 hours which has been already reported to induce synthetic lethality. Data are shown as the mean ± SD, n=3. ***P<0.001 between two indicated groups, two-way ANOVA. D Ranking of drugs according to the Log (Selectivity index). SI (Selectivity index) =IC50(786-O VHL-/-) / IC50(786-O wtVHLoe). SI>15 were identified as the synthetic lethal hits which were marked in colors. E Dose response curve of 786-O VHL-isogenic cell pair treated with Alisertib for 72 hours originated from screening result. F-I Validation of the SKPin C1 induced-synthetic lethality. VHL-isogenic RCC cell pair (F) and VHL non-isogenic RCC cell pair (H) were treated with SKPin C1 for 72 hours, the cell viability was detected by alarm blue assays. Data are shown as the mean ± SD, n=3. *P<0.05, **P<0.01, ***P<0.001 between two indicated groups, Student's t-test. (F). The representative images of cell density in VHL-isogenic RCC cell pair (G) and VHL non-isogenic RCC cell pair (I) treated with the indicated concentration of SKPin C1. J-K SKP2 inhibition on cell viability in VHL-isogenic cell pair. 786-O VHL-/- and786-O wtVHLoe cells were transfected with 25 nM, 50 nM SKP2 siRNA and incubated for 48 hours. Western blotting analysis of SKP2 protein level GAPDH was used as a loading control (J). The cell viability was evaluated by AlarmBlue assays. Data are shown as the mean ± SD, n=3. ns denotes not significant (K).
Figure 2
Figure 2
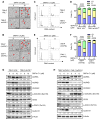
SKPin C1 increased mitotic cell population and up-regulated mitotic kinases and cyclins in VHL-deficient RCC cells. A-B The images of cell morphology change after SKPin C1 treatment. VHL-isogenic RCC cell pairs were treated with 10 μM SKPin C1 for 24 hours (A), and VHL non-isogenic RCC cell pairs were treated with 6 μM SKPin C1 for 24 hours (B), the representative images of cell morphology were taken by IncuCyte ZOOM. The arrow indicates the rounding cell. C-F SKPin C1 effect on the cell cycle. VHL-isogenic RCC cell pair (C) and VHL non-isogenic RCC cell pair (E) were treated with the indicated concentration of SKPin C1. After staining with propidium iodide (PI), the cell cycle was detected by flow cytometry. The percentage of VHL-isogenic RCC cell pair (D) and VHL non-isogenic RCC cell pair (F) distributed in the G1, S, and G2/M phases from the flow cytometry analysis. Data are shown as the mean ± SD, n=3. ****P<0.0001 between two indicated groups, Student's t-test. G-H Western blot analysis of cell cycle kinase and cyclin protein levels in SKPin C1-treated VHL-isogenic RCC cell pair (G) and VHL non-isogenic RCC cell pair (H).
Figure 3
Figure 3
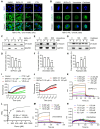
SKPin C1 induced mitotic arrest in VHL-deficient RCC cells via disrupting spindle formation and microtubule networks. A-D SKPin C1 effect on the expression and localization of Cyclin B. RCC cells were treated with 5 μM SKPin C1 for 24 hours. Immunofluorescence analysis of Cyclin B (green) and DNA (DAPI, blue) in SKPin C1-treated 786-O VHL-/- cells (A), 786-O wtVHLoe cells (B), 769-P cells (C), Caki cells (D). Enlarged images showed the representative cells in metaphase, pro-metaphase and anaphase. E-F Immunofluorescent analysis of Phospho-Histone H3 (Mitotic Marker). VHL-isogenic RCC cell pair were treated with 5 μM SKPin C1 for 24 hours, subsequently stained with phospho-Histone H3 antibody (red) and DAPI (blue) to show the cells undergoing mitosis (E). Quantification of the percentage of mitotic cells, the total cells are defined by the DAPI (blue) staining. Data are shown as the mean ± SD, n=3, independent experiments. For each experiment, at least 100 cells from each treatment condition were analyzed), *P<0.05 between two indicated groups, Student's t-test (F). G-H Western blot analysis of cleaved caspase-3 in SKPin C1-treated VHL-isogenic RCC cell pair (G) and VHL non-isogenic RCC cell pair (H). I Immunofluorescent analysis of mitotic spindle. VHL-isogenic RCC cell pair were treated with 5 μM SKPin C1 for 24 hours, subsequently stained with α-tubulin antibody (green), Aurora A (red), and DAPI (blue) to show the mitotic spindle morphology. Aurora A localizes at the centrosome in metaphase to present the spindle pole. J-K Immunofluorescent analysis of microtubule network. 786-O wtVHLoe cells (J),786-O VHL-/- (K) were treated with 5 μM SKPin C1 for 24 hours, subsequently stained with α-tubulin antibody (green) and DAPI (blue). Enlarged images showed the representative microtubule. The arrow showed the mitotic cells.
Figure 4
Figure 4
SKPin C1 binds to tubulin and destabilizes microtubule. A-B Comparison the effect of SKPin C1 with representative microtubule targeting agents on microtubule network and spindle formation. 786-O VHL-/- cells were treated with 5 μM SKPin C1, 400nM Vinorelbine, 200nM Paclitaxel for 24 hours, stained with α-tubulin antibody(green) and DAPI (blue) to monitor the cell microtubules (A) and mitotic spindle morphology (B). C-H Evaluation of the effect of drugs on microtubule polymerization in a cell population. 786-O VHL-/- cells were treated with the indicated concentration of SKPin C1 (C), vinorelbine(E), or paclitaxel(G) for 24 hours, the α-tubulin protein in soluble fractions (S) and polymerized fractions (P) were analyzed by western blotting, GAPDH was used as loading control. Quantification of the ratio of the polymerized/total α-tubulin (sum of the soluble and polymerized fractions) with the treatment of SKPin C1 (D), vinorelbine (F), or paclitaxel (H). Data are shown as mean ± SD (n=3). **P < 0. 01 between two indicated groups, one-way ANOVA (D, F, H). I-J Tubulin polymerization assay in vitro performed to determine drugs effect on tubulin polymerization activity with the indicated concentration. Paclitaxel was used as a positive control, Vinorelbine was used as a negative control. K-N Biolayer interferometry (BLI) analysis of the interaction between drugs and tubulin protein. Biotin-labeled tubulin was dipped in increasing concentration of SKPin C1 (K), vinorelbine (M) or decitabine (N) to measure their binding affinity with tubulin. L Steady state graph showed the KD (M) value between SKPin C1 and tubulin protein.
Figure 5
Figure 5
Microtubule dynamics and stability are altered in VHL-deficient RCC cells. A-B Overexpression of EB1-EGFP in VHL-isogenic RCC cell pair. Western blot analysis of EB1-EGFP expression (A). EB1-EGFP comets were taken by Nikon confocal A1 and indicated with the white arrows (B). C-E Evaluation of microtubule dynamics in VHL-isogenic RCC cell pair. The EB1-EGFP videos were recorded by a Nikon TiE Widefield Microscope. Parameters of microtubule dynamics were analyzed with the plusTip Tracker, including growth speed (C), growth lifetime (D), and growth length (E). Data are shown as the mean ± SD, n=5 independent experiments. For each experiment, at least 9 cells from each treatment condition were analyzed. **P < 0.01, Student's t-test. ns denotes not significant. F-G Analysis of the GTP-tubulin amount in VHL-isogenic RCC cell pair. Immunofluorescence staining for GTP-tubulin (green), α-tubulin (red) and DAPI (blue), the fluorescence intensity in the green and red channels was quantified using image J, followed by calculating the fluorescence intensity ratio (green/red). Data are shown as the mean ± SD, n=5, **P < 0.01 between two indicated groups, Student's t-test (G). H-I Detection of the polymerized tubulin amount in VHL-isogenic RCC cell pair. The α-tubulin protein in soluble fractions (S) and polymerized fractions (P) were analyzed by western blotting, GAPDH was used as loading control (H). Quantification of the ratio of the polymerized/total α-tubulin (sum of the soluble and polymerized fractions). Data are shown as mean ± SD (n=3). **P < 0.01 between two indicated groups, Student's t-test (I). J-K Comparation of the acetyl-α-Tubulin in VHL-isogenic RCC cell pair via immunofluorescence staining (J), and the immunofluorescence intensity of acetyl-α-Tubulin were quantified, data are shown as mean ± SD. ***P<0.001 between two indicated groups, Student's t-test (K).
Figure 6
Figure 6
SKPin C1 sensitizes microtubule dynamics in VHL-deficient RCC. A SKPin C1 effect on microtubule dynamics in VHL-isogenic RCC cell pairs. Single frame of the video acquired from Olympus SpinSR10 Spinning Disk Confocal Microscope at different time points. B-C VHL-isogenic RCC cell pair were treated with 5 μM SKPin C1 for 24 hours, representative immunofluorescence staining for GTP-tubulin (green) and α-tubulin (red) (B), and the immunofluorescence intensity were quantified, data are shown as mean ± SD. *P<0.05 between two indicated groups, Student's t-test. ns denotes not significant (C). D-E VHL-isogenic cell pair were treated with 9 μM,10 μM SKPin C1 for 24 hours, the α-tubulin protein in soluble fractions (S) and polymerized fractions (P) were analyzed by western blotting, GAPDH was used as loading control (D). Quantification of the ratio of the polymerized/total α-tubulin (sum of the soluble and polymerized fractions). Data are shown as mean ± SD (n=3). **P<0.01 between two indicated groups, Student's t-test (E). F-G VHL-isogenic cell pair were treated with 10 μM SKPin C1 for different times and subsequently stained with Acetyl-α-Tubulin antibody (green) and DAPI (blue) to monitor the stabilized microtubule changes (F). Quantification of the ratio of cells with Acetyl-α-Tubulin and the total number of the cells which defined by DAPI (blue) staining. Data are shown as mean ± SD (n=3), **P<0.01 between two indicated groups, Two-way ANOVA (G).
Figure 7
Figure 7
VHL loss is synthetic lethal with anti-microtubule agents in RCC cells. A Dose-response curve of 786-O VHL-isogenic cell pair treated with different microtubule targeting agents for 72 hours. Data are shown as the mean ± SD, n=3. ****P<0.0001, **P<0.01 between two indicated groups, two-way ANOVA. ns denotes not significant. B-G SKPin C1, vinorelbine inhibited tumor growth in the 786-O cell xenograft mice model. Tumor growth curve analysis of 786-O cell xenograft mice treated with SKPin C1 (B) or vinorelbine (D). Data are shown as the mean ± SD, n=5, **P < 0.01, between two indicated groups, one-way ANOVA. Tumor wet weight of 786-O cell xenograft mice treated with SKPin C1 (C) or vinorelbine (E). Data are shown as the mean ± SD, n=5, *P < 0.05 between two indicated groups, two-way ANOVA. Body weight analysis of 786-O cell xenograft mice treated with SKPin C1 (F) or vinorelbine (G). Data are shown as the mean ± SD, n=5.
Figure 8
Figure 8
Combination of anti-microtubule agent and HIF-2α inhibitor enhanced the antitumor effect on VHL-deficient RCC cells. A-D Cotreatment of SKPin C1 (B) or vinorelbine (D) with HIF-2α siRNA in 786-O cells for 72 hours, the cell viability was detected by alarm blue assays. Data are shown as the mean ± SD, n=3, *P<0.5, **P<0.01 between two indicated groups, Student's t-test. Western blot analysis of the expression of HIF-2α (A, C). E Proposed working model of the synthetic lethality between microtubule dynamic disruption and VHL deficiency.

Similar articles

References

    1. Hsieh JJ, Purdue MP, Signoretti S, Swanton C, Albiges L, Schmidinger M. et al. Renal cell carcinoma. Nat Rev Dis Primers. 2017;3:17009. - PMC - PubMed
    1. Kjaer M, Frederiksen PL, Engelholm SA. Postoperative radiotherapy in stage II and III renal adenocarcinoma. A randomized trial by the Copenhagen Renal Cancer Study Group. Int J Radiat Oncol Biol Phys. 1987;13:665–72. - PubMed
    1. Amato RJ. Chemotherapy for renal cell carcinoma. Semin Oncol. 2000;27:177–86. - PubMed
    1. Gez E, Libes M, Bar-Deroma R, Rubinov R, Stein M, Kuten A. Postoperative irradiation in localized renal cell carcinoma: the Rambam Medical Center experience. Tumori. 2002;88:500–2. - PubMed
    1. Koneru R, Hotte SJ. Role of cytokine therapy for renal cell carcinoma in the era of targeted agents. Curr Oncol. 2009;16(Suppl 1):S40–4. - PMC - PubMed

MeSH terms