. 2025 Apr 3;28(5):112345.
doi: 10.1016/j.isci.2025.112345. eCollection 2025 May 16.

Characterization of Gαs and Gαolf activation by catechol and non-catechol dopamine D1 receptor agonists

Affiliations

Characterization of Gαs and Gαolf activation by catechol and non-catechol dopamine D1 receptor agonists

Anh Minh Nguyen et al. iScience. .

Abstract

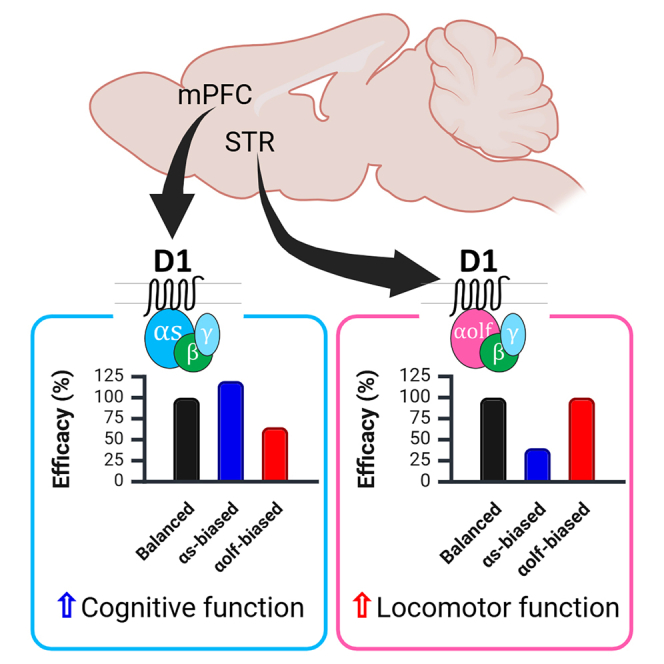
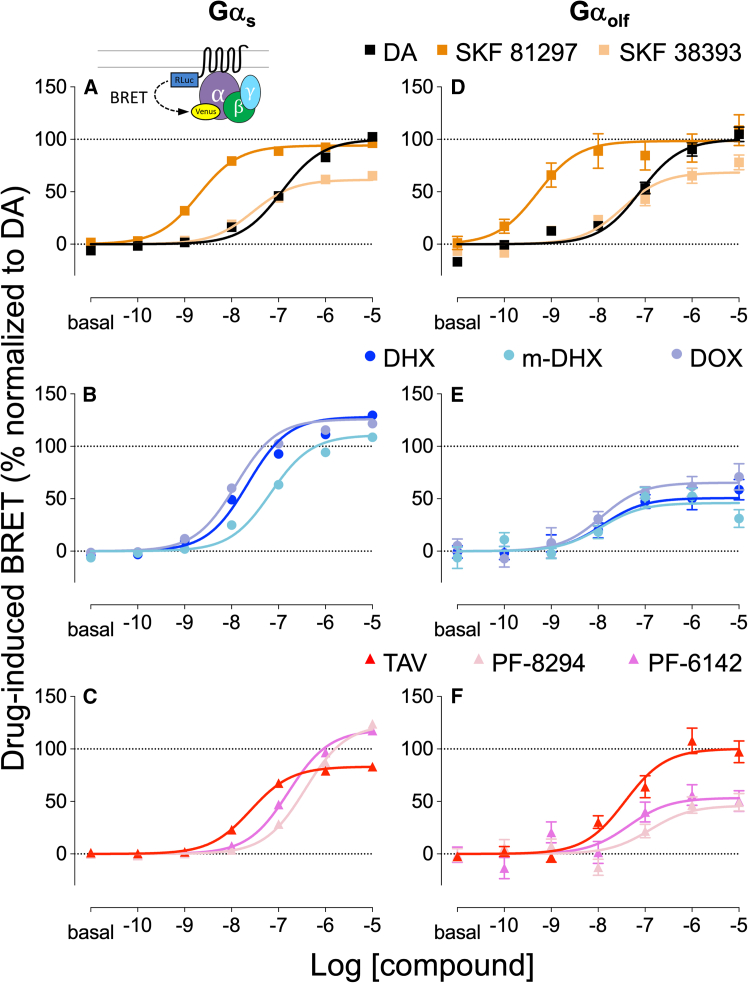
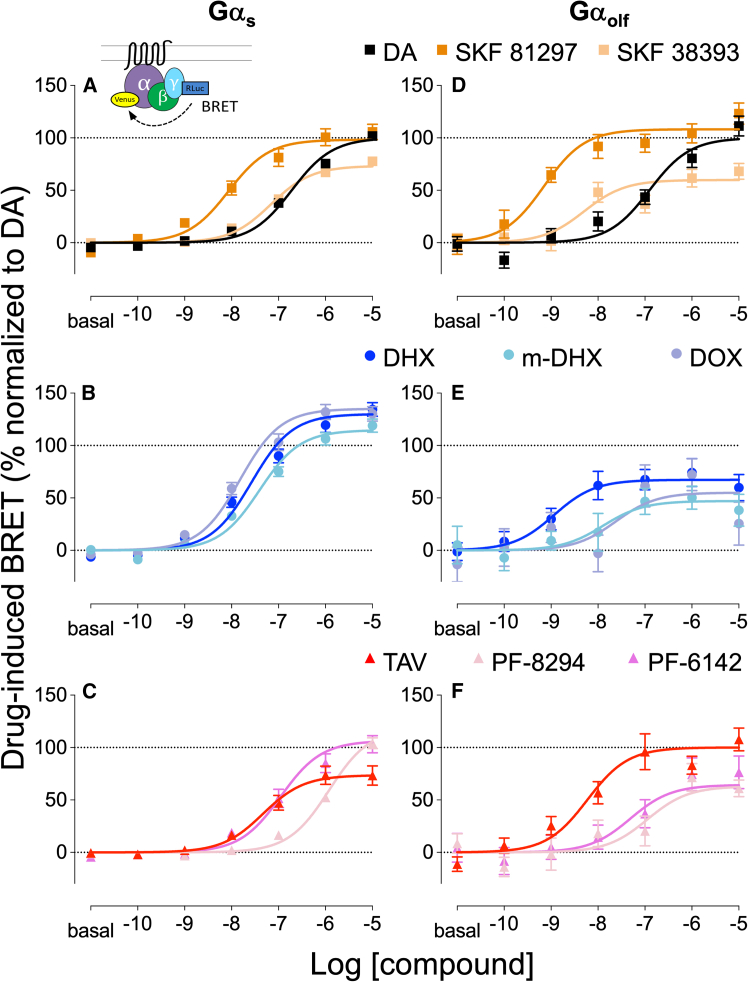
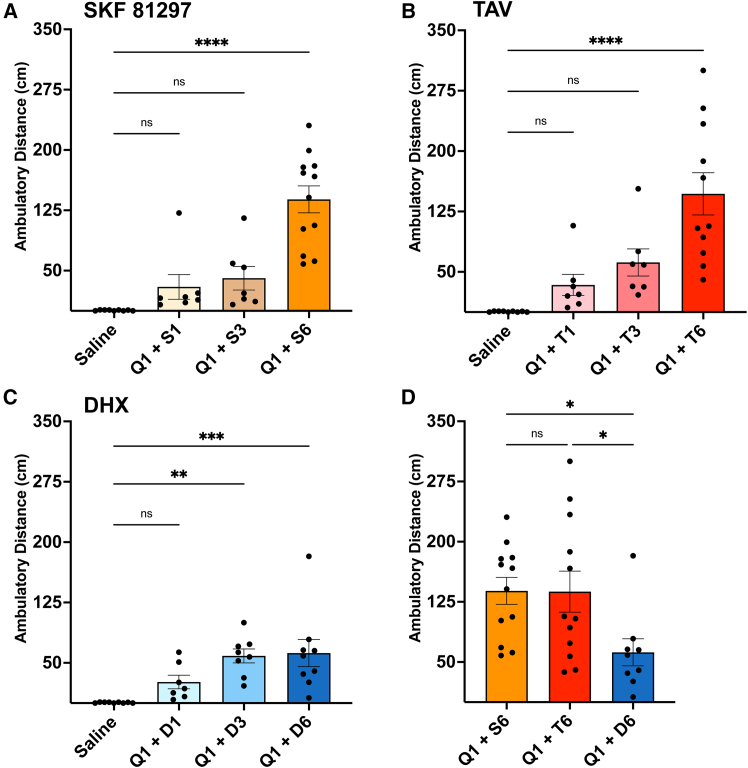
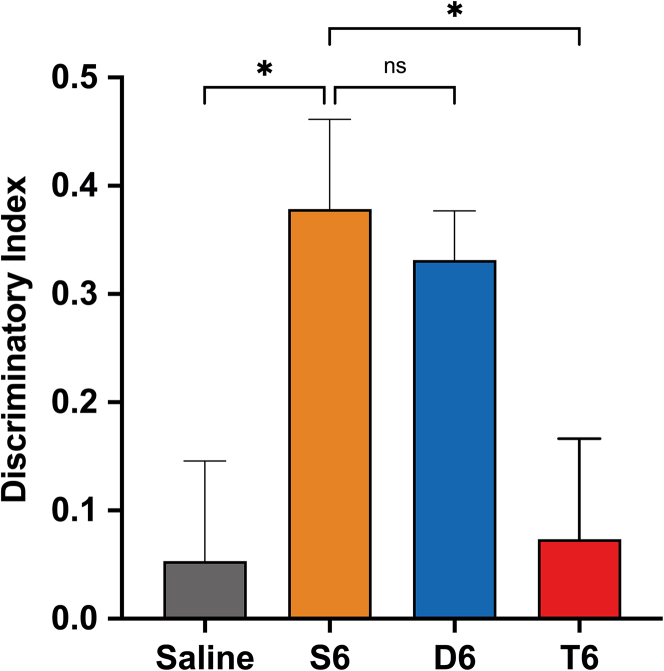
The dopamine D1 receptor (D1R) couples to Gαs and Gαolf and is crucial in regulating neurological and neuropsychiatric functions. In the brain, Gαolf is predominantly found in the striatum whereas Gαs is expressed elsewhere. Our in vitro assays revealed that the tetracyclic catechol agonists dihydrexidine, methyl-dihydrexidine, doxanthrine, and the non-catechol compounds PF-8294, PF-6142 exerted full agonism for Gαs coupling but only partial agonism for Gαolf coupling. In contrast, the non-catechol agonist tavapadon acted as a full agonist at Gαolf and a partial agonist at Gαs. The effects of these ligands on the thalamocortical and striatonigral electrophysiological events, as well as on the locomotor activity and cognitive function of mice agreed with their selectivity profiles in vitro. These findings suggest the possibility of achieving region-specific pharmacology and open new directions for developing D1R drugs to treat relevant neurological and neuropsychiatric disorders.

Keywords: Molecular biology; Neuroscience.


Conflict of interest statement

The authors declare no competing financial interests.

Figures

None
Graphical abstract
Figure 1
Figure 1
D1R agonist-induced D1R-Gαs and -Gαolf engagement Drug-induced BRET ratio change between D1R-Rluc8 and Gαs-Venus (A–C) or Gαolf-Venus (D–F) in response to DA (black), SKF 81297 (dark orange), SKF 38393 (light orange) (top row), DHX (blue), m-DHX (light blue), DOX (violet) (middle row), TAV (red), PF-8294 (pink), and PF-6142 (magenta). Results were normalized to the Emax of DA response for D1R-Gαs (A–C) and D1R-Gαolf (D–F) and presented as mean ± SEM (n ≥ 5).
Figure 2
Figure 2
D1R agonist-induced D1R-Gαs and -Gαolf activation Drug-induced BRET ratio change between γ7-Rluc8 and Gαs-Venus (A–C) or Gαolf-Venus (D–F) in response to DA (black), SKF 81297 (dark orange), SKF 38393 (light orange) (top row), DHX (blue), m-DHX (light blue), DOX (violet) (middle row), TAV (red), PF-8294 (pink), and PF-6142 (magenta). Results were normalized to the Emax of DA response for D1R-Gαs (A–C) and D1R-Gαolf (D–F) and presented as mean ± SEM (n ≥ 5).
Figure 3
Figure 3
D1R agonist-induced cAMP production via Gαs and Gαolf Drug-induced fluorescence change of the cAMP biosensor Pink Flamindo in D1R-Gαs (A–C) or D1R-Gαolf (D–F) in response to DA (black), SKF 81297 (dark orange), SKF 38393 (light orange) (top row), DHX (blue), m-DHX (light blue), DOX (violet) (middle row), TAV (red), PF-8294 (pink), and PF-6142 (magenta). Results were normalized to the Emax of DA response for D1R-Gαs (A–C) and D1R-Gαolf (D–F) and presented as mean ± SEM (n ≥ 5).
Figure 4
Figure 4
D1R agonist-induced cAMP production via Gαolf/s chimera (A) Cryo-EM structure of TAV-bound D1R and mini-Gαs complex (PDB: 7X2D). (B) The ICL2-αN interface of the D1R-Gαs complex. Molecular graphics were generated in PyMOL 3.1. Drug-induced fluorescence change of Pink Flamindo detecting cAMP level for DA (black), SKF81297 (orange), SKF38393 (light orange) (C), DHX (blue), m-DHX (light blue), DOX (violet) (D), TAV (red), PF-8294 (pink), and PF-6142 (magenta) (E). Results were normalized to the Emax of DA response for Gαs, Gαolf/s chimera (αN), Gαolf and presented as mean ± SEM (n ≥ 5). Comparison of the Emax across Gαs, αN, and Gαolf was done using one-way ANOVA followed by post-hoc Tukey test. , ∗∗, ∗∗∗, ∗∗∗∗p < 0.05, 0.01, 0.001, 0.0001, respectively.
Figure 5
Figure 5
s and Gαolf activities in brain slice electrophysiology ChR2-YFP injection in the mediodorsal thalamus projecting to the prelimbic/infralimbic mPFC of D1R-tdTomato mouse (A) and in the dorsal striatum projecting to the SNr of WT mouse (D). Scale bar: 500 μm. Average traces of the optically elicited ChR2-driven EPSCs in the mPFC (B) and IPSCs in the SNr (E) following 2 ms of photostimulation by blue light. Analysis of the D1R-mediated potentiation of EPSCs in the mPFC (C) IPSCs in the SNr (F) for 1.0 μM SKF81297, DHX, and TAV (orange, blue, and red) was done using one-way ANOVA followed by post-hoc Tukey test. ∗, ∗∗, ∗∗∗p < 0.05, 0.01, 0.001 respectively.
Figure 6
Figure 6
D1R agonists effect on locomotor activity (A–C) Psychomotor stimulatory effect of SKF-81297 [S] (A), TAV [T] (B), and DHX [D] (C) at 1, 3, 6 mg/kg (S1, S3, S6 etc.) in combination with 1 mg/kg quinpirole (Q1) on DA-depleted reserpinized mice. ∗, ∗∗, ∗∗∗, ∗∗∗∗p < 0.05, 0.01, 0.001, 0.0001, respectively, compared to the effect of saline using one-way ANOVA followed by post-hoc Dunnett test. (D) Comparison of the ambulatory distance induced by these drugs at 6 mg/kg was done using one-way ANOVA followed by post-hoc Tukey test. ∗, ∗∗, ∗∗∗, ∗∗∗∗p < 0.05, 0.01, 0.001, 0.0001, respectively.
Figure 7
Figure 7
D1R agonists effect on cognitive function using the novel object recognition assay Comparison of the discriminatory index (DI) of WT mice following the administration of SKF-81297 [S6], TAV [T6], and DHX [D6] at 6 mg/kg ∗p < 0.05 compared to the SKF 81297-injected group using one-way ANOVA followed by post-hoc Dunnett test.

Similar articles

Cited by

References

    1. De Keyser J., Claeys A., De Backer J.P., Ebinger G., Roels F., Vauquelin G. Autoradiographic localization of D1 and D2 dopamine receptors in the human brain. Neurosci. Lett. 1988;91:142–147. doi: 10.1016/0304-3940(88)90758-6. - DOI - PubMed
    1. Hegarty S.V., Sullivan A.M., O'Keeffe G.W. Midbrain dopaminergic neurons: a review of the molecular circuitry that regulates their development. Dev. Biol. 2013;379:123–138. doi: 10.1016/j.ydbio.2013.04.014. - DOI - PubMed
    1. Beaulieu J.M., Gainetdinov R.R. The physiology, signaling, and pharmacology of dopamine receptors. Pharmacol. Rev. 2011;63:182–217. doi: 10.1124/pr.110.002642. - DOI - PubMed
    1. Waszczak B.L., Martin L.P., Finlay H.E., Zahr N., Stellar J.R. Effects of individual and concurrent stimulation of striatal D1 and D2 dopamine receptors on electrophysiological and behavioral output from rat basal ganglia. J. Pharmacol. Exp. Ther. 2002;300:850–861. doi: 10.1124/jpet.300.3.850. - DOI - PubMed
    1. Vermeulen R.J., Drukarch B., Sahadat M.C., Goosen C., Wolters E.C., Stoof J.C. The dopamine D1 agonist SKF 81297 and the dopamine D2 agonist LY 171555 act synergistically to stimulate motor behavior of 1-methyl-4-phenyl-1,2,3,6-tetrahydropyridine-lesioned parkinsonian rhesus monkeys. Mov. Disord. 1994;9:664–672. doi: 10.1002/mds.870090613. - DOI - PubMed

LinkOut - more resources