. 2025 Apr 15;17(4):2527-2540.
doi: 10.62347/ZTGP5030. eCollection 2025.

GLS1 promotes lipid metabolism in hepatocellular carcinoma by regulating the PI3K/AKT/mTORC1 signaling pathway through SREBP-1

Affiliations

GLS1 promotes lipid metabolism in hepatocellular carcinoma by regulating the PI3K/AKT/mTORC1 signaling pathway through SREBP-1

Yaocheng Sun et al. Am J Transl Res. .

Abstract

Objectives: Cancer cells exhibit altered metabolic profiles. Glutaminase 1 (GLS1), a key enzyme in cancer cells, promoting glutamine catabolism to glutamate and ammonia, is strongly associated with various human malignancies.

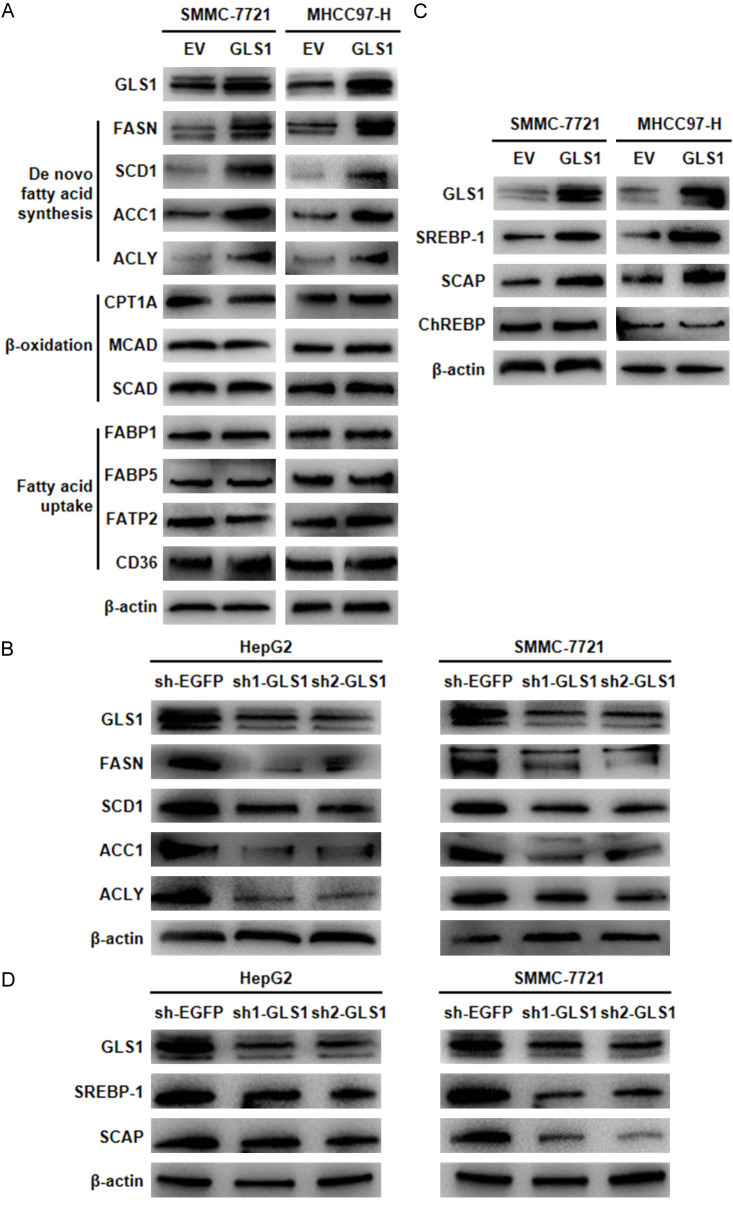
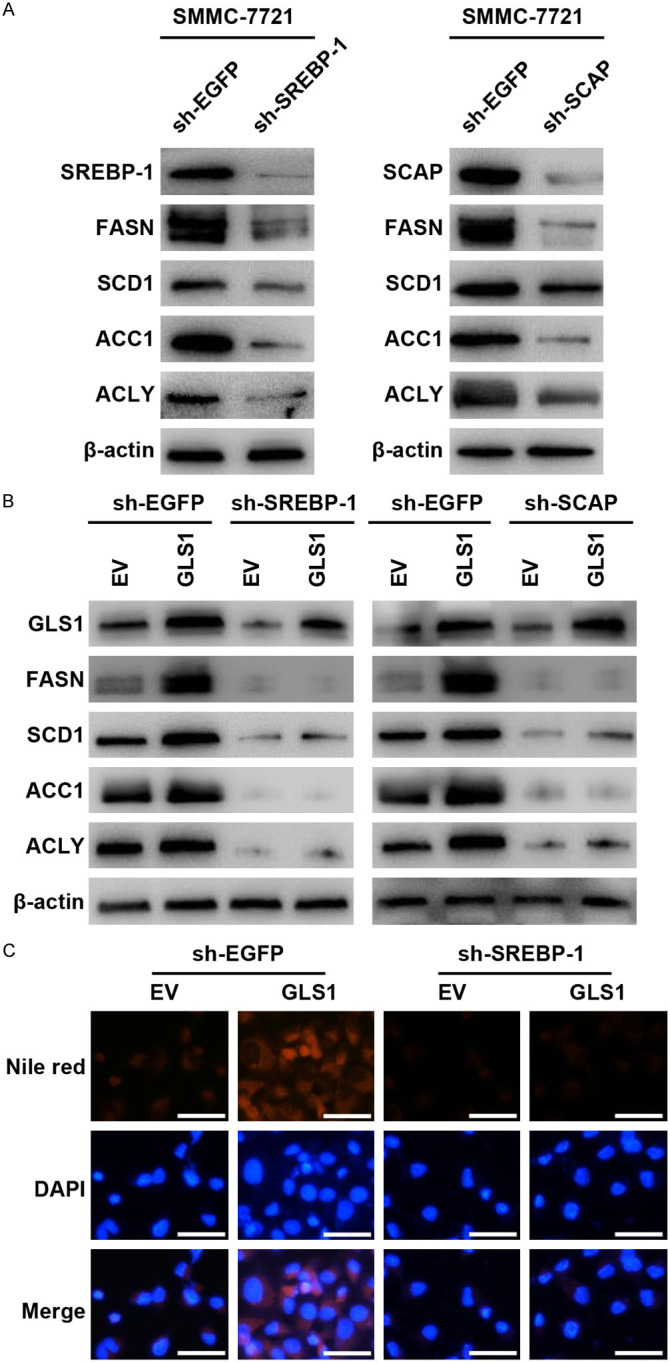
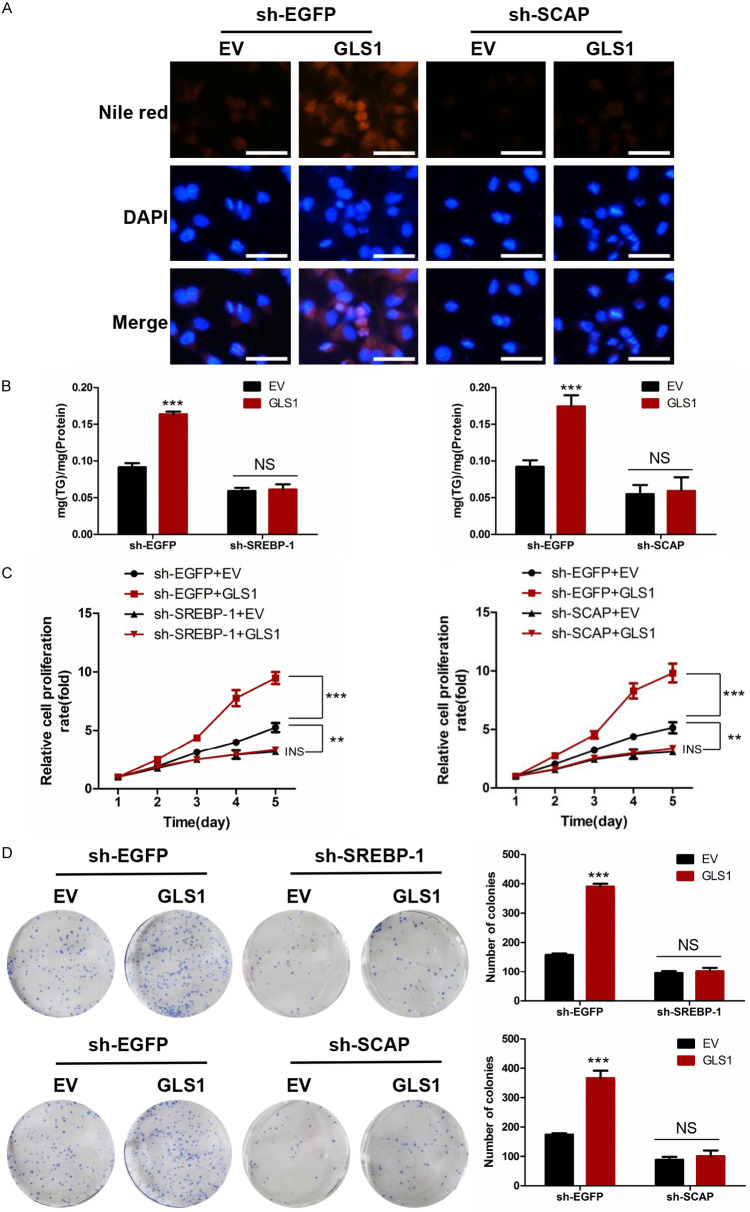
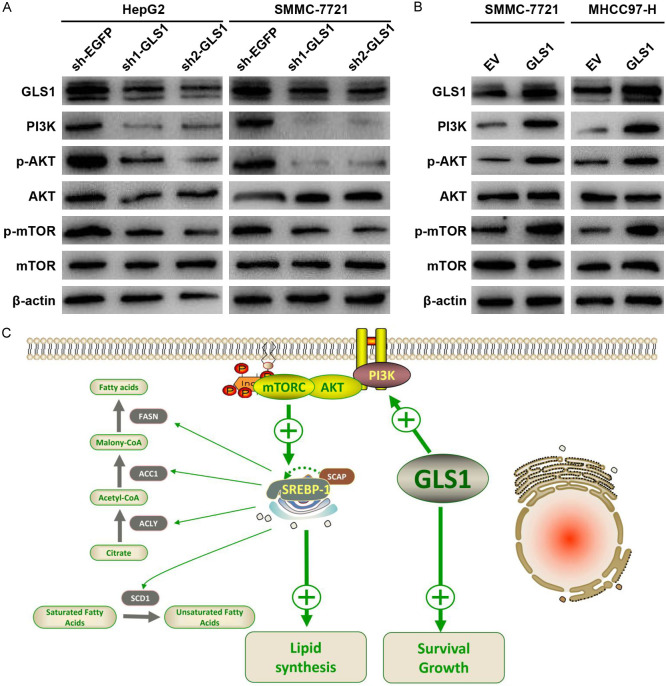
Methods: GLS1 promotes lipid accumulation and cell proliferation by upregulating the expression of sterol regulatory element-binding protein 1 (SREBP-1) and SREBP cleavage-activating protein (SCAP). Mechanistically, GLS1 promotes lipid metabolism in HCC cells through the activation of the PI3K/AKT/mTORC pathway.

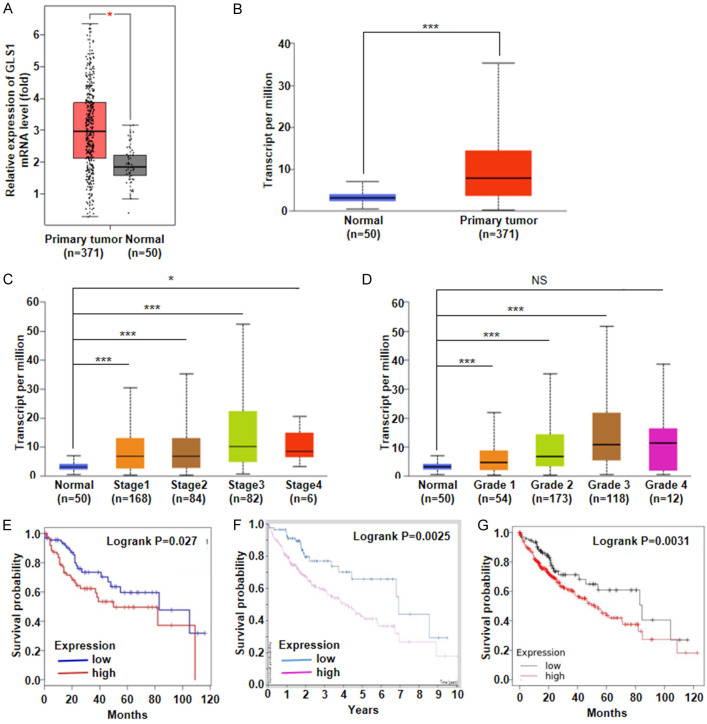
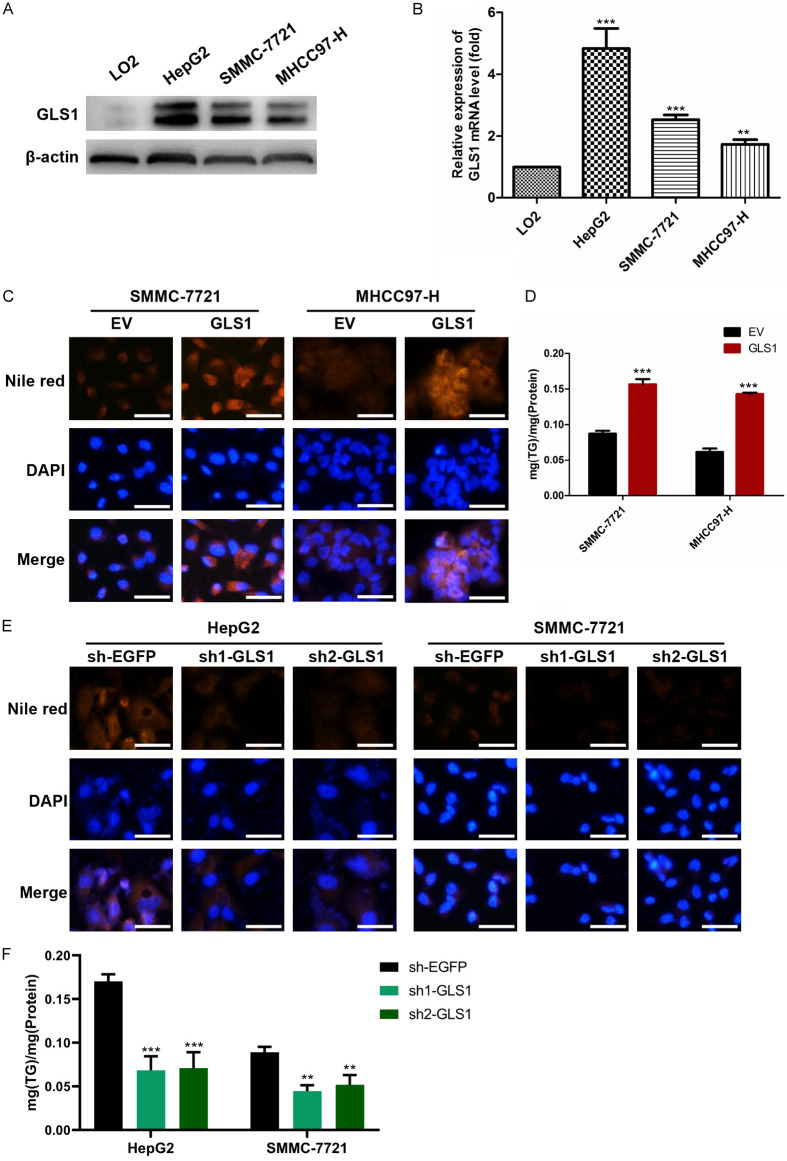
Results: GLS1's role in lipid metabolism in hepatocellular carcinoma (HCC) remains unexplored. Our findings indicate that GLS1 is not only significantly overexpressed in HCC but also negatively correlates with clinical prognosis. Further investigation revealed that GLS1 drives lipid accumulation and de novo fatty acid synthesis in HCC.

Conclusions: Our study suggests that GLS1 mediates SREBP-1 to drive lipid metabolism in HCC via the phosphatidylinositol-3-kinase/protein kinase B/mammalian target of rapamycin complex 1 (PI3K/AKT/mTORC1) signaling pathway, thus we present GLS1 as a potential biomarker and therapeutic target for HCC.

Keywords: GLS1; Hepatocellular carcinoma; PI3K/AKT/mTORC1 signaling pathway; SREBP-1; lipid metabolism.


Conflict of interest statement

None.

Figures

Figure 1
Figure 1
Bioinformatics analysis indicated that Glutaminase 1 (GLS1) was high-expressed in hepatocellular carcinoma (HCC) and was correlated with poor survival. (A, B) Gene Expression Profiling Interactive Analysis (GEPIA) (A) and UALCAN (http://ualcan.path.uab.edu/index.html) (B) Two databases were used to analyze the mRNA level of GLS1 in HCC samples and normal liver samples. (C) UALCAN database was used to analyze the mRNA level of GLS1 in different stages of HCC. (D) The mRNA level of GLS1 in different grades of HCC was analyzed in the UALCAN database. (E-G) GEPIA, The Human Protein Atlas (HPA), and Kaplan-Meier Plotter databases were used for survival analysis to evaluate the influence of GLS1 on the overall survival of HCC patients. *P<0.05, ***P<0.001, NS: no significance.
Figure 2
Figure 2
GLS1 promotes lipid accumulation in hepatocellular carcinoma. A, B. Relative expression levels of GLS1 protein and mRNA were assessed in LO2, HepG2, SMMC-7721, and MHCC97-H. C. Cellular neutral lipids were measured in SMMC-7721 and MHCC97-H cells overexpressing GLS1 by Nile red staining. Scale bars, 50 μm. D. Cellular triglyceride (TG) was measured in SMMC-7721 and MHCC97-H cells overexpressing GLS1 by Biochemical Triglyceride Determination Kit. E. Cellular neutral lipids were measured in HepG2 and SMMC-7721 cells expressing sh-EGFP, sh1-GLS1, or sh2-GLS1 by Nile red staining. Scale bars, 50 μm. F. Cellular TG was measured in SMMC-7721 and MHCC97-H cells expressing sh-EGFP, sh1-GLS1, or sh2-GLS1 by Biochemical Triglyceride Determination Kit. The data are shown as the mean ± s.d. of three independent experiments, **P<0.01, ***P<0.001.
Figure 3
Figure 3
GLS1 promotes de novo fatty acid synthesis in hepatocellular carcinoma. A. Protein levels of metabolic enzymes were determined by Western blot in SMMC-7721 and MHCC97-H cells overexpressing GLS1. β-Actin served as loading control. B. Protein levels of metabolic enzymes in de novo fatty acid synthesis were determined by Western blot in HepG2 and SMMC-7721 cells expressing sh-EGFP, sh1-GLS1, or sh2-GLS1. β-Actin served as loading control. C. Protein levels of a transcription factor in de novo fatty acid synthesis and SCAP were determined by Western blot in SMMC-7721 and MHCC97-H cells overexpressing GLS1. β-Actin served as loading control. D. Protein levels of SREBP-1 and SCAP were determined by Western blot in HepG2 and SMMC-7721 cells expressing sh-EGFP, sh1-GLS1, or sh2-GLS1. β-Actin served as loading control. Each experiment was examined in triplicate.
Figure 4
Figure 4
GLS1 promotes fatty acid synthetic enzymes protein and lipid accumulation via SREBP-1 and SCAP. A. Protein levels of SREBP-1, SCAP, and metabolic enzymes in de novo fatty acid synthesis were determined by Western blot in SMMC-7721 expressing sh-EGFP, sh-SREBP-1, or sh-SCAP. β-Actin served as loading control. B. Protein levels of GLS1 and metabolic enzymes in de novo fatty acid synthesis were determined after knocking down SREBP-1 or sh-SCAP in SMMC-7721 overexpressing GLS1 by Western blot. β-Actin served as loading control. C. Cellular neutral lipids were measured after overexpressing GLS1 and knocking down SREBP-1 in SMMC-7721 cells by Nile red staining. Scale bars, 50 μm. Each experiment was examined in triplicate.
Figure 5
Figure 5
GLS1 promotes lipid accumulation and cell proliferation via SREBP-1 and SCAP. A. Cellular neutral lipids were measured after overexpressing GLS1 and knocking down SCAP in SMMC-7721 cells by Nile red staining. Scale bars, 50 μm. B. Cellular TG was measured after knocking down SREBP-1 or sh-SCAP in SMMC-7721 overexpressing GLS1 by Biochemical Triglyceride Determination Kit. C. Relative cell proliferation rate was measured after knocking down SREBP-1 or sh-SCAP in SMMC-7721 overexpressing GLS1 by CCK-8 assay. D. Colony forming assay was performed after knocking down SREBP-1 or sh-SCAP in SMMC-7721 overexpressing GLS1. The data are shown as the mean ± s.d. of three independent experiments, **P<0.01, ***P<0.001, NS: no significance.
Figure 6
Figure 6
GLS1 affects PI3K-AKT-mTORC1 signaling mediated SREBP-1 in HCC cells. A. Protein levels of PI3K, p-AKT, AKT, p-mTOR, and mTOR were determined in HepG2 and SMMC-7721 cells expressing sh-EGFP, sh1-GLS1, or sh2-GLS1. β-Actin served as loading control. B. Protein levels of PI3K, p-AKT, AKT, p-mTOR, and mTOR were determined in SMMC-7721 and MHCC97-H cells overexpressing GLS1. β-Actin served as loading control. C. Schematic model illustrating the effect of GLS1 on PI3K-AKT-mTORC1 signaling and lipid metabolism in HCC. Each experiment was examined in triplicate.

Similar articles

References

    1. Xing M, Wang X, Kiken RA, He L, Zhang JY. Immunodiagnostic biomarkers for hepatocellular carcinoma (HCC): the first step in detection and treatment. Int J Mol Sci. 2021;22:6139. - PMC - PubMed
    1. Wang J, Li J, Tang G, Tian Y, Su S, Li Y. Clinical outcomes and influencing factors of PD-1/PD-L1 in hepatocellular carcinoma. Oncol Lett. 2021;21:279. - PMC - PubMed
    1. Giraud J, Chalopin D, Blanc JF, Saleh M. Hepatocellular carcinoma immune landscape and the potential of immunotherapies. Front Immunol. 2021;12:655697. - PMC - PubMed
    1. Yang JD, Hainaut P, Gores GJ, Amadou A, Plymoth A, Roberts LR. A global view of hepatocellular carcinoma: trends, risk, prevention and management. Nat Rev Gastroenterol Hepatol. 2019;16:589–604. - PMC - PubMed
    1. Kanwal F, Khaderi S, Singal AG, Marrero JA, Loo N, Asrani SK, Amos CI, Thrift AP, Gu X, Luster M, Al-Sarraj A, Ning J, El-Serag HB. Risk factors for HCC in contemporary cohorts of patients with cirrhosis. Hepatology. 2023;77:997–1005. - PMC - PubMed

LinkOut - more resources