Leather Shaving Waste Extract as an Electrochemical Modifier at a Pencil Graphite Electrode for Paracetamol Determination in Pharmaceuticals
- PMID: 40385183
- PMCID: PMC12079254
- DOI: 10.1021/acsomega.4c08502
Leather Shaving Waste Extract as an Electrochemical Modifier at a Pencil Graphite Electrode for Paracetamol Determination in Pharmaceuticals
Abstract
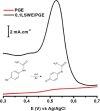
A simple, facile, and sensitive method based on leather shaving waste extract (LSWE) modified pencil graphite electrode (PGE) was developed to determine paracetamol (PAR) by employing the square wave adsorptive stripping voltammetry (SW-AdSV) technique. Leather shaving waste (LSW) was characterized by energy-dispersive X-ray spectroscopy and by investigating its morphology by taking scanning electron microscopy (SEM) images. The extraction process was conducted on an LSW by utilizing acetonitrile. Furthermore, the extraction ratio of LSW to acetonitrile was optimized and found to be 0.1 g LSW/10 mL acetonitrile at room temperature for an extraction period of 12 h. Modification of PGE by 0.1 g of LSWE (0.1LSWE/PGE) was done by performing cyclic voltammetry (CV) at the potential range 0-(+2.3) V for 10 cycles, followed by a characterization process of 0.1LSWE/PGE by employing CV, electrochemical impedance spectroscopy, and SEM techniques. PAR determination parameters at 0.1LSWE/PGE were optimized and found to be an accumulation time of 35 s in Britton Robinson buffer solution at pH 1.8. A linear relationship (r 2 = 0.997) was observed between peak current and PAR concentration within the range 5-100 μM, with a sensitivity of 196.46 μA μM-1 cm-2. The limit of detection and limit of quantification were found to be 1.6 and 4.51 μM, respectively. Neglected interferant influence on the determination of PAR at 0.1LSWE/PGE was observed in the presence of dopamine, uric acid, caffeine, ascorbic acid, Na+, K+, Mg2+, Ca2+, NO3 -, and Cl- ions. In order to evaluate 0.1LSWE/PGE in the determination of PAR in real pharmaceutical samples, different common PAR-containing pharmaceuticals in Türkiye were analyzed, achieving a recovery range of 99.76-102.87%.
© 2025 The Authors. Published by American Chemical Society.
Conflict of interest statement
The authors declare no competing financial interest.
Figures


References
-
- UNIDO Wastes Generated in the Leather Products Industry; United nations industrial development organization: Zlin, Czech Republic, 2000.
-
- Chen X.; Xu L.; Ren Z.; Jia F.; Yu Y. Sustainable Supply Chain Management in the Leather Industry: A Systematic Literature Review. International Journal of Logistics Research and Applications 2023, 26 (12), 1663–1703. 10.1080/13675567.2022.2104233. - DOI
-
- Bhat N.Technical Eia Guidance Manuals for Leather/Skin/Hide Processing Industry; Ministry of Environment & Forests, Government of India: India, 2009.
-
- Ahmed M. D.; Maraz K. M. Benefits and Problems of Chrome Tanning in Leather Processing: Approach a Greener Technology in Leather Industry. Materials Engineering Research 2021, 3 (1), 156–164. 10.25082/MER.2021.01.004. - DOI
-
- Covington A. D.Tanning Chemistry: The Science of Leather; Royal Society of Chemistry, 2009.
LinkOut - more resources
Full Text Sources
Miscellaneous
