. 2025 May 1:16:1580890.
doi: 10.3389/fpls.2025.1580890. eCollection 2025.

Integrating genome and transcriptome-wide data to explore the expression dynamics of TCP genes in Pisum sativum under salt stress

Affiliations

Integrating genome and transcriptome-wide data to explore the expression dynamics of TCP genes in Pisum sativum under salt stress

Song Fangyuan et al. Front Plant Sci. .

Abstract

Salt stress severely restricts plant growth and productivity. TCP genes, which are plant-specific transcription factors, play a crucial role in the stress response. However, their functions in pea (Pisum sativum) remain poorly understood. Here, we identified 21 PsTCP genes in pea, classified into Class I (PCF) and Class II (CYC/TB1 and CIN) through phylogenetic analysis. While physicochemical properties varied significantly within the PsTCP family, gene structures and conserved motifs were highly conserved among subfamilies. Comparative homology analysis revealed closer relationships between pea TCP genes and dicots (Arabidopsis) than monocots (rice). Cis-regulatory element analysis suggested roles in growth, hormone response, and stress adaptation. Under salt stress, PsTCP genes exhibited divergent expression patterns, with PsTCP17 showing significant upregulation under extreme stress. Weighted gene co-expression network (WGCNA) and gene ontology (GO) enrichment analyses identified PsTCP20 as a hub gene regulating photosynthesis and metabolic processes. Tissue-specific expression across 11 pea tissues further highlighted their functional diversity. This study provides insights into the molecular mechanisms of salt stress responses in pea and offers genetic resources for breeding salt-tolerant varieties.

Keywords: Pisum sativum; TCP gene family; WGCNA; salt stress; tissue-specific expression.


Conflict of interest statement

The authors declare that the research was conducted in the absence of any commercial or financial relationships that could be construed as a potential conflict of interest.

Figures

Figure 1
Figure 1
Phylogenetic analysis of TCP proteins. (A) The phylogenetic tree of PsTCP and AtTCP proteins, where blue circles represent pea TCP genes, and orange squares represent A. thaliana TCP genes. (B) The distribution of the three subfamilies in the PsTCP gene family. (C) The distribution of the three subfamilies in the AtTCP gene family. The colors in the figure represent the following: blue for the PCF subfamily, green for the CYC/TB1 subfamily, and orange for the CIN subfamily.
Figure 2
Figure 2
Domain multiple sequence alignment of PsTCP proteins. OsTCP1 represents the TCP protein from rice, and AtTCP1 represents the TCP protein from A. thaliana. The bar chart at the bottom indicates the level of sequence conservation, with longer red bars representing higher conservation and shorter blue bars indicating lower conservation.
Figure 3
Figure 3
Conserved domains, motif analysis, and gene structure analysis of PsTCP genes. (A) The phylogenetic tree of PsTCP and the distribution of 10 motifs, with motifs 1 to 10 represented by rectangles in different colors. (B) The gene structure of PsTCP, where orange boxes represent coding sequences (CDS) black lines represent introns, and blue boxes represent the 5’ and 3’ untranslated regions. (C) The sequence identification of motifs 1 and 2, with colored letters representing the specific amino acid sequences of the motifs.
Figure 4
Figure 4
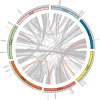
Genomic distribution, duplication events, and synteny analysis of PsTCP genes. The figure displays the synteny analysis of the PsTCP gene family in pea, where gray lines represent syntenic regions in the pea genome, and orange lines indicate duplicated PsTCP gene pairs. Genes marked in orange represent PsTCP genes with duplication events. Chromosome numbers are labeled within the boxes for each chromosome.
Figure 5
Figure 5
Cis-regulatory element analysis of the PsTCP gene promoter regions. The 2000 bp upstream sequences of each PsTCP family gene were extracted as promoter regions, and cis-regulatory elements were predicted using the PlantCARE database. Based on their functions related to plant growth and development, phytohormone responsive, and abiotic and biotic stress responses, the cis-regulatory elements were classified into three major categories. (A) A heatmap showing the number of functional cis-regulatory elements in each PsTCP gene across the three subfamilies. The darker the color, the higher the number of elements; (B) Statistical analysis of the number of cis-regulatory elements in each PsTCP gene, categorized by function: plant growth and development, phytohormone responsive, and abiotic and biotic stress response; (C) Specific distribution of cis-regulatory elements in the promoter regions.
Figure 6
Figure 6
Expression profiles of PsTCP genes under different NaCl concentrations. (A) Bar chart showing the expression levels. Gene names are labeled above each subplot. The x-axis represents the expression levels, and the y-axis represents different treatment groups. The bar chart displays the average expression levels of the samples in each treatment group, with error bars representing the standard deviation (SD). (B) Heatmap of expression levels. Red indicates high expression, while blue indicates low expression. Gene names are shown on the right side of the heatmap, and treatment samples are displayed below. The classification of the three subfamilies is labeled on the right. Genes with expression levels below 1 in all treatments have been filtered out.
Figure 7
Figure 7
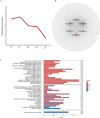
WGCNA and GO enrichment analysis (A) Expression patterns of genes in the blue module. (B) Co-expression network of PsTCP family genes in the blue module, where red nodes represent PsTCP family genes, green nodes represent other module genes co-expressed with PsTCP genes, and gray lines indicate co-expression relationships between genes. (C) GO functional enrichment analysis of genes co-expressed with PsTCP family genes in the blue module.

Similar articles

Cited by

  • Functional Genomics: From Soybean to Legume.
    Zhou C, Wang H, Zhu X, Li Y, Zhang B, Tadege M, Wu S, Qi Z, Xia Z. Zhou C, et al. Int J Mol Sci. 2025 Jun 30;26(13):6323. doi: 10.3390/ijms26136323. Int J Mol Sci. 2025. PMID: 40650105 Free PMC article. Review.

References

    1. Ali Q., Ahmad M., Kamran M., Ashraf S., Shabaan M., Babar B. H., et al. . (2023). Synergistic effects of rhizobacteria and salicylic acid on maize Zea mays salt-stress tolerance. Plants 12, 5219. doi: 10.3390/plants12132519 - DOI - PMC - PubMed
    1. Amarakoon D., Thavarajah D., Mcphee K., Thavarajah P. (2012). Iron-, zinc-, and magnesium-rich field peas (Pisum sativum L.) with naturally low phytic acid: A potential food-based solution to global micronutrient malnutrition. J. Food Composition Anal. 27, 8–13. doi: 10.1016/j.jfca.2012.05.007 - DOI
    1. Amirbakhtiar N., Ismaili A., Ghaffari M.-R., Mirdar Mansuri R., Sanjari S., Shobbar Z.-S. (2021). Transcriptome analysis of bread wheat leaves in response to salt stress. PloS One 16, e0254189. doi: 10.1371/journal.pone.0254189 - DOI - PMC - PubMed
    1. Bailey T. L., Boden M., Buske F. A., Frith M., Grant C. E., Clementi L., et al. . (2009). MEME Suite: tools for motif discovery and searching. Nucleic Acids Res. 37, W202–W208. doi: 10.1093/nar/gkp335 - DOI - PMC - PubMed
    1. Ben Amor N., Jiménez A., Boudabbous M., Sevilla F., Abdelly C. (2020). Chloroplast implication in the tolerance to salinity of the halophyte Cakile maritima . Russian J. Plant Physiol. 67, 507–514. doi: 10.1134/S1021443720030048 - DOI

LinkOut - more resources