[Preprint]. 2025 May 9:2025.05.08.25327176.
doi: 10.1101/2025.05.08.25327176.

Single cell multiomics and 3D genome architecture reveal novel pathways of human heart failure

Affiliations

Single cell multiomics and 3D genome architecture reveal novel pathways of human heart failure

Yang Xie et al. medRxiv. .

Abstract

Heart failure is a leading cause of morbidity and mortality; yet gene regulatory mechanisms driving cell type-specific pathologic responses remain undefined. Here, we present the cell type-resolved transcriptomes, chromatin accessibility, histone modifications and chromatin organization of 36 non-failing and failing human hearts profiled from 776,479 cells spanning all cardiac chambers. Integrative analyses revealed dynamic changes in cell type composition, gene regulatory programs and chromatin organization, which expanded the annotation of cardiac cis-regulatory sequences by ten-fold and mapped cell type-specific enhancer-gene interactions. Cardiomyocytes and fibroblasts particularly exhibited complex disease-associated cellular states, gene regulatory programs and global chromatin reorganization. Mapping genetic association data onto cell type-specific regulatory programs revealed likely causal genetic contributors to heart failure. Together, these findings provide comprehensive, multimodal gene regulatory maps of the human heart in health and disease, offering a valuable framework for designing precise cell type-targeted therapies for treating heart failure.


Conflict of interest statement

Competing interests: The following authors declare competing interests. Consultancy fees: SGD (Abbott), KJG (Genentech). KJG has received honoraria from Pfizer, holds stock in Neurocrine Biosciences, and his spouse is employed at Altos Labs. SGD acknowledges research support from Novartis. RME is an employee and shareholder of Pfizer. BR is a shareholder and consultant of Arima Genomics Inc. and cofounder of Epigenome Technologies, Inc. All other authors declare no competing interests.

Figures
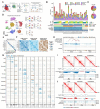
Fig. 1.
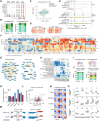
Fig. 1.. Single-cell multiomic, histone modification and Hi-C analyses uncover cell type-specific transcriptome, epigenome and 3D genome maps of adult human hearts.
(A) Schematic outlines the workflow of single-cell 10x Multiome, Droplet Paired-Tag, and Droplet Hi-C studies of cardiac chambers from heart failure (HF) and control (Non-HF) donors. HF donors include donors with ischemic cardiomyopathy (ICM) and non-ischemic cardiomyopathy (NICM). (B) Stacked bar charts reveal the cardiac cell type proportions for each donor (top). Donor clinical metadata (donor age, gender and condition) along with the number of nuclei profiled for each single-cell sequencing modality is shown below. (C) Pie charts display the percentage of cardiac cell types in Non-HF and HF samples. (D) Uniform Manifold Approximation and Projection (UMAP) shows the clustering of 767,479 nuclei into major cardiac cell types based on transcriptome or gene activity features from all single-cell sequencing modalities. UMAPs on the right show the nuclei contribution from single-cell sequencing modalities to each major cardiac cell type cluster. (E) The expression of selected marker genes is shown in dot plot across the 12 major cardiac cell types. (F) Heatmaps display the scaled, averaged epigenetic signals (ATAC, H3K27ac and H3K27me3) for selected marker genes in (E). (G) Genome browser tracks reveal aggregated epigenetic profiles for all major cardiac cell types at selected marker gene loci. (H) Genome browser track shows an example of cCRE-gene links for TNNT2 in vCMs (top). Putative TNNT2 enhancers and epigenomic landscape for vCM versus myeloid lineage are displayed (bottom). (I, J) Representative examples of cell type-specific Hi-C contact maps are shown for FBN1 (I) and TBX5 (J) loci at 10 kb resolution. −log2 insulation score (IS), compartment score and genome browser tracks for chromatin accessibility and histone modifications are shown below. vCM, ventricular cardiomyocytes; aCM, atrial cardiomyocytes; SM, smooth muscle cell.
Fig. 2.
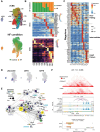
Fig. 2.. Comprehensive epigenomic profiling of human cardiac cell types reveals their gene regulation.
(A) Heatmap shows chromatin accessibility signal of cCREs in 11 NMF modules (M0-M10) across 12 major cell types. (B) Heatmap shows emission probability of three epigenetic marks across five chromatin states as identified by ChromHMM (top); boxplot shows the genomic coverage of ChromHMM annotated chromatin states (bottom). (C) Stacked bar charts show the percentage of cCREs annotated in each chromatin state across all major cell types. (D) Stacked bar charts show the proportion of chromatin states over cCREs in each NMF module described in (B) across all major cell types. (E) Heatmap shows H3K27ac signal on cCREs in cell type-specific distal cCRE-gene links. (F) Heatmap shows gene expression level of target genes associated with cCREs from (E) in cell type-specific distal cCRE-gene links. (G) Dot plot shows top enriched GO terms from GSEA analysis of cell type-specific genes targeted by distal cCREs in each cell type. P-values were calculated using a permutation test in GSEA tool. (H) 222 HOMER known TF motifs were found enriched in cCREs from cell type-specific distal cCRE-gene links. Example motifs in different cell types are shown. (I) Representative genome browser tracks are shown for ChromHMM chromatin states across all major cell types on selected cell type-specific distal cCRE-gene links, including MYL2 (vCM-specific), KCNJ3 (aCM-specific), EGFLAM (Pericyte-specific), FBN1 (Fibroblast-specific), VWF (Endothelial-specific) and MARCO (Myeloid-specific).
Fig. 3.
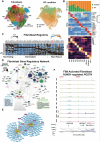
Fig. 3.. Cell type-specific epigenetic changes direct gene regulatory responses during heart failure.
(A) Dot plot shows the number of genomic regions and genes identified from differential analysis between heart failure (HF) and non-heart failure (Non-HF) conditions across cell types. (B) Sankey plots show the chromatin state dynamics for differentially accessible cCREs in HF and Non-HF hearts. Percentage was calculated as the averaged percentage of chromatin states across cell types. (C) Scatter plots compare the log2 fold changes of gene expression (GEX) and chromatin accessibility (ATAC) for genes and cCREs from putative ABC links between HF and Non-HF conditions. Links are colored based on whether the associated gene and/or cCRE is classified as differentially expressed (DEG) or differentially accessible (DAR). (D) Normalized aggregate peak analysis (APA) scores of Droplet Hi-C signals in vCM and myeloid cells are shown for vCM down-regulated and myeloid up-regulated ABC links. APA scores are represented as P2LL (peak-to-lower-left) values. (E) Genome browser tracks show an example of a differential ABC link targeting PM20D2 in vCM. Pseudobulk chromatin accessibility tracks across selected cardiac cell types (top) as well as differential epigenetic signals and chromatin states in HF versus Non-HF vCMs (bottom) are shown. (F) Heatmap shows the enrichment of HF- or Non-HF-associated transcription factor (TF)-regulated gene regulatory networks (GRNs) calculated from fGSEA across selected cell types (top). Only GRNs with absolute normalized enrichment score (NES) ≥ 2 and with consistent differential TF expression results are shown. Asterisk indicates significant enrichment (adjusted P-value < 0.05), with P-values estimated based on an adaptive multi-level split Monte-Carlo scheme in fgsea package. Log2 fold changes of each TF corresponding to the respective GRN are also shown (bottom). Asterisk indicates significant enrichment (adjusted P-value < 0.05), calculated using Wald test in DESeq2 package and corrected for multiple testing using Benjamini-Hochberg FDR correction. (G) Network plots illustrate representative vCM GRNs in Non-HF versus HF conditions. (H) Heatmap shows enrichment of gene ontology (GO) terms for HF-associated TF GRN-targeted genes in vCMs (top). Pie charts below show the chromatin state percentage for HF-associated GRNs-targeting cCREs under Non-HF and HF conditions (bottom). Asterisk indicates significant enrichment (adjusted P-value < 0.05). P-values were calculated using hypergeometric test in enrichGO and corrected for multiple testing using Benjamini-Hochberg FDR correction. (I) Venn diagrams show the overlap of FOS target genes and cCREs in vCMs versus myeloid. (J) Sankey plot shows the dynamic changes of vCM chromatin states of FOS-targeted chromatin regions in HF versus Non-HF conditions for vCMs and myeloid. (K) Bar chart indicates the number of switched compartments in HF versus Non-HF for selected major cell types. (L) Volcano plot shows the log2 fold changes and adjusted P-value of differentially expressed genes in vCMs between Non-HF and HF conditions. Genes that overlap with switched compartments are colored in blue (A to B) or red (B to A). Example genes shown in (M) are labeled. P-values were calculated and corrected as described in (F). (M) Representative genome browser track of compartment scores in HF versus Non-HF vCMs for DIAPH3 and PRELID2. Compartments that shifted are shaded in grey. (N) Saddle plots show compartmentalization strength comparison in selected major cell types between Non-HF and HF conditions. Numbers indicate A-A (bottom right) and B-B (top left) compartment interaction strengths. (O) Boxplots compare intra- (A-A or B-B) and inter-compartment (A-B) interaction strengths in Non-HF versus HF cell types in young-aged (≤60 years) donors.
Fig. 4.
Fig. 4.. Gene regulatory network analysis of ventricular cardiomyocytes uncovers genetic programs controlling their cellular states.
(A) UMAPs show vCM cell subpopulations and their RNA velocity derived trajectories (top) and the contribution of HF and non-HF vCMs to each subpopulation (bottom). (B) Each vCM cell subpopulation exhibits distinct cellular contributions (top, bar graph) from each heart condition as well as gene expression (middle, heatmap) and chromatin accessibility (bottom, heatmap). (C) SCENIC+ TF GRNs for each vCM cell subpopulation is shown in heatmap. The box is colored by transcription factor (TF) expression, and the dot size shows the regulon specificity score (RSS). (D) UMAPs display the gene expression of marker genes for distinct vCM disease states. (E) Analyzing the TF network within the vCM GRN inferred the interactions between distinct GRNs across non-HF and HF vCM subpopulations. Nodes are colored by pseudotime of expression. Node size is determined by their degree of centrality in the network, and edges represent TF-TF connections. (F) Hi-C contact maps (top) and representative genome browser tracks at NPPA and NPPB locus display pseudobulk epigenetic signals, chromatin states and ABC links associated with NPPA and NPPB in HF versus non-HF conditions. Box plot of balanced Hi-C contacts in non-HF versus HF conditions reveals decreased enhancer-NPPA contacts and increased enhancer-NPPB contacts in HF vCMs (bottom).
Fig. 5.
Fig. 5.. Gene regulatory network analysis of cardiac fibroblasts reveals genetic programs directing their cellular states.
(A) UMAP shows fibroblast cell (FB) subpopulations and their trajectories as detected by RNA velocity (left). UMAP labeled by HF condition reveals the contribution of non-HF and HF fibroblast cells to each subpopulation (right). (B) Each cardiac fibroblast cell subpopulation displays distinct cellular contributions (top, bar graph) from each heart condition as well as gene expression (middle, heatmap) and chromatin accessibility (bottom, heatmap). (C) Heatmap shows SCENIC+ predicted TF GRNs for each cardiac fibroblast cell subpopulation. The box is colored by transcription factor expression, and the dot size shows the regulon specificity score (RSS). TFs in red are associated with FB9-Activated Fibroblasts. (D) Interrogating the TF network within the cardiac fibroblast GRN identifies interactions between distinct GRNs across cardiac fibroblast states. Nodes are colored by pseudotime of expression. Node size is determined by their degree of centrality in the network, and edges represent TF-TF connections. Gene Ontology (GO) terms for the FB9-Activated Fibroblasts and FB10-Myofibroblasts are shown. (E) Network plot of the RUNX1 and RUNX2 regulons shows their target genes including known gene markers of activated fibroblasts (colored in magenta). (F) Representative genome browser tracks at POSTN locus display aggregated chromatin accessibility profiles of each FB subpopulation and co-accessible peaks linked to POSTN (below, loops), including two SCENIC+ predicted peaks for the RUNX1 regulon.
Fig. 6.
Fig. 6.. Fine-mapping of genetic loci associated with cardiovascular traits and heart failure.
(A) Heatmap displays LD score regression (LDSC) enrichment of trait-associated variants in all cCREs as well as cCREs in the open (Open) or active (Active) chromatin state across distinct cardiac cell types. Color represents the level of enrichment. (B) Bar plots quantify the number of fine-mapped variants (Variants) and loci (Signals) overlapping all, open and active cCREs in LDSC-enriched cell types. (C) Heatmap represents the cumulative posterior probability association (PPA) values of fine-mapped variants associated with dilated cardiomyopathy (DCM) across cardiac cell types. The cytogenetic band of the lead variant was used as the locus identifier. (D) Heatmap indicates whether predicted target gene annotations coincide with the prioritized genes from Zheng et al. (7). SCENIC+ inferred links (Co-Acc), ABC links, or Hi-C loops were used to assign putative target genes. A target gene annotation was considered different if a method did not find a prioritized target gene from Zheng et al. (E) Network plot shows the vCM subpopulation GRN overlap with cCREs harboring fine-mapped variants. Node size represents the centrality score from SCENIC+, while node color intensity indicates the number of variants overlapping GRN-associated cCREs (nodes in teal have no overlapping variants). (F) Network plot shows the GRNs and target genes overlapping GWAS variants for the two vCM subpopulations containing the highest number of GWAS variants (vCM9 and vCM10). (G) Stacked bar chart represents the overlap of fine-mapped DCM genetic variants with cCREs across cardiac cell types (left). Colors indicate PPA ranges: 0.01–0.1, 0.1–0.3, and >0.3. Heatmaps display the overlap between variants and chromatin state classification, exclusivity of variant localization within CM cCREs, ChromBPNet functional predictions, and a log2 fold-change heatmap of differential chromatin accessibility between HF and non-HF aCMs and vCMs from DESeq2 (FDR < 0.1, right). Additionally, cCRE-to-gene links are visualized based on co-accessibility, ABC, or Hi-C methods. The colorimetric scheme applies to both boxplots and listed target genes, distinguishing each annotation method. (H) Hi-C contact map displays the interactions between a cCRE harboring the HF risk variant rs13277721 and the TRAPPC9 promoter (top). Genome browser tracks show aggregated chromatin accessibility, histone modifications and chromatin state heatmap for non-HF and HF vCMs (middle). Motif plot shows ChromBPNet functional predictions comparing the protective allele (G) and risk allele (A), highlighting disruption of an AP-2α motif by the HF risk allele (bottom).

References

    1. Khan M. S., Shahid I., Bennis A., Rakisheva A., Metra M., Butler J., Global epidemiology of heart failure. Nat. Rev. Cardiol. 21 (2024), pp. 717–734. - PubMed
    1. Olivotto I., Udelson J. E., Pieroni M., Rapezzi C., Genetic causes of heart failure with preserved ejection fraction: emerging pharmacological treatments. Eur. Heart J. 44, 656–667 (2023). - PubMed
    1. Heymans S., Lakdawala N. K., Tschöpe C., Klingel K., Dilated cardiomyopathy: causes, mechanisms, and current and future treatment approaches. Lancet. 402 (2023), pp. 998–1011. - PubMed
    1. Gigli M., Stolfo D., Merlo M., Sinagra G., Taylor M. R. G., Mestroni L., Pathophysiology of dilated cardiomyopathy: from mechanisms to precision medicine. Nat. Rev. Cardiol. 22 (2024), pp. 183–198. - PMC - PubMed
    1. Arvanitis M., Tampakakis E., Zhang Y., Wang W., Auton A., Agee M., Aslibekyan S., Bell R. K., Bryc K., Clark S. K., Elson S. L., Fletez-Brant K., Fontanillas P., Furlotte N. A., Gandhi P. M., Heilbron K., Hicks B., Hinds D. A., Huber K. E., Jewett E. M., Jiang Y., Kleinman A., Lin K. H., Litterman N. K., McCreight J. C., McIntyre M. H., McManus K. F., Mountain J. L., Mozaffari S. V., Nandakumar P., Noblin E. S., Northover C. A. M., O’Connell J., Pitts S. J., Poznik G. D., Sathirapongsasuti J. F., Shastri A. J., Shelton J. F., Shringarpure S., Tian C., Tung J. Y., Tunney R. J., Vacic V., Wang X., Zare A. S., Dutta D., Glavaris S., Keramati A., Chatterjee N., Chi N. C., Ren B., Post W. S., Battle A., Genome-wide association and multi-omic analyses reveal ACTN2 as a gene linked to heart failure. Nat. Commun. 11 (2020), doi:10.1038/s41467-020-14843-7. - DOI - PMC - PubMed

Publication types

LinkOut - more resources