[Preprint]. 2025 May 6:2025.04.17.25326042.
doi: 10.1101/2025.04.17.25326042.

Integrative multi-omics QTL colocalization maps regulatory architecture in aging human brain

Affiliations

Integrative multi-omics QTL colocalization maps regulatory architecture in aging human brain

Xuewei Cao et al. medRxiv. .

Abstract

Multi-trait QTL (xQTL) colocalization has shown great promises in identifying causal variants with shared genetic etiology across multiple molecular modalities, contexts, and complex diseases. However, the lack of scalable and efficient methods to integrate large-scale multi-omics data limits deeper insights into xQTL regulation. Here, we propose ColocBoost, a multi-task learning colocalization method that can scale to hundreds of traits, while accounting for multiple causal variants within a genomic region of interest. ColocBoost employs a specialized gradient boosting framework that can adaptively couple colocalized traits while performing causal variant selection, thereby enhancing the detection of weaker shared signals compared to existing pairwise and multi-trait colocalization methods. We applied ColocBoost genome-wide to 17 gene-level single-nucleus and bulk xQTL data from the aging brain cortex of ROSMAP individuals (average N = 595 ), encompassing 6 cell types, 3 brain regions and 3 molecular modalities (expression, splicing, and protein abundance). Across molecular xQTLs, ColocBoost identified 16,503 distinct colocalization events, exhibiting 10.7(±0.74)-fold enrichment for heritability across 57 complex diseases/traits and showing strong concordance with element-gene pairs validated by CRISPR screening assays. When colocalized against Alzheimer's disease (AD) GWAS, ColocBoost identified up to 2.5-fold more distinct colocalized loci, explaining twice the AD disease heritability compared to fine-mapping without xQTL integration. This improvement is largely attributable to ColocBoost's enhanced sensitivity in detecting gene-distal colocalizations, as supported by strong concordance with known enhancer-gene links, highlighting its ability to identify biologically plausible AD susceptibility loci with underlying regulatory mechanisms. Notably, several genes including BLNK and CTSH showed sub-threshold associations in GWAS, but were identified through multi-omics colocalizations which provide new functional support for their involvement in AD pathogenesis.


Conflict of interest statement

Competing interests The authors declare no competing interests.

Figures

Figure 1.
Figure 1.. Overview of ColocBoost for multi-trait colocalization.
a. ColocBoost uses a multi-task gradient boosting model with proximity smoothing to identify colocalized variants across multiple molecular traits (demonstrated here with gene expression, splicing and protein abundance traits) and when applicable, further integrating GWAS (demonstrated here with Alzheimer’s GWAS). b. ColocBoost takes as input either (i) individual-level genotype and trait data, or (ii) summary-level association statistics for different traits with a well-matched LD reference panel, and performs analysis in either of the xQTL-only and GWAS-xQTL modes. c. By allowing for multiple causal variants M and molecular traits L, xQTL-only and GWAS-xQTL ColocBoost can accommodate up to M×2LL1 and M×2L1 potential variant-trait causal configurations. In the schematic, distinct colocalization signals (red) are represented by 95% colocalization confidence sets (CoS) associated with traits sharing this signal, each capturing a putative causal variant with 95% probability. Uncolocalized signals unique to specific traits (yellow) are distinguished by ColocBoost from the colocalized events. More details on ColocBoost model and algorithm can be found in Methods and Supplementary Figure S1.
Figure 2.
Figure 2.. Performance comparison of ColocBoost with other multi-trait colocalization methods in simulation benchmarks.
a. Statistical power and False Discovery Rate (FDR) comparisons of ColocBoost against COLOC (V5), MOLOC and HyPrColoc, in simulation settings involving 2, 5, 10, and 20 traits, up to five causal variants per trait per locus, with genotype data and induced colocalization configurations designed to mimic real-world xQTL datasets. Details of power and FDR calculations are provided in Methods. The X-axis represents the maximum number of causal variants across traits. b. Representative simulation examples illustrating limitations of competing methods: HyPrColoc with “one-causal-variant-per-trait” assumption fails to detect causal signals under (i) heterogeneous effects distribution across traits and (ii) where another non-causal variant with shared LD with causal variants has strongest marginal effect; (iii) COLOC (V5) shows reduced sensitivity to weak causal effects in the “disease-like” trait. c. Variant-level precision-recall curves by varying the colocalization score threshold (ColocBoost uses VCP; COLOC/HyPrColoc/MOLOC use variant-level scores from their respective methods; Methods and Supplementary Note S.6). d. Statistical power and FDR comparisons for disease-prioritized mode of ColocBoost (GWAS-xQTL) where there is a simulated “disease trait”, for which we lower the per-SNP heritability in the locus relative to other molecular traits to reflect expectations from real world applications. e. Statistical power and FDR comparison of ColocBoost with OPERA for GWAS colocalization, evaluated at the gene level (Methods). The red dashed line in panels a, d, and e denote the FDR threshold 0.05 corresponding to 95% CoS. Numerical results are reported in Supplementary Data.
Figure 3.
Figure 3.. ColocBoost xQTL analysis across cell types and traits modalities.
ColocBoost was applied to 17 gene-level cis-xQTL datasets from the aging brain cortex of ROSMAP subjects (average N=595) spanning 16,928 genes. a. UpSet plot summarizing the colocalization patterns across three different molecular trait modalities (expression, splicing, protein abundance). See Table 2 for details of each modality. b. Distribution of the number of 95% CoS corresponding to the different numbers of colocalized traits per locus; we omit from consideration 0.55% loci with more than 10 colocalized traits. c. UpSet plot summarizing the colocalization patterns across 6 pseudo-bulk brain cell-type eQTL data, along with bulk-xQTL data. We highlight putative causal variants with (i) shared effect across multiple brain cell types, and (ii) cell-type specific effect obtained through colocalization between bulk xQTL and pseudo-bulk eQTL for that cell type. d. The fraction of cell-type specific colocalizations (measured at the level of CoS) for different brain cell types recovered by fine-mapping credible set within the cell type. e. Top 4 significantly enriched (FDR<0.05) pathways (using enrichKEGG) for eGenes linked to cell-type specific colocalizations in excitatory neurons and microglia. Size of the circle denotes the number of eGenes matched to the pathway and the color denotes the level of FDR-adjusted significance. f. For each pair of brain cell types, we assess the homogeneity in estimated causal effects directions by measuring the proportion of colocalized signals exhibiting concordant effect size signs. g. Empirical distribution of the number of 95% CoS in terms of the number of variants each CoS contained. CoS are color-coded by purity, with high-purity sets (purity > 0.8) distinguished from moderate-purity sets (0.5 < purity ≤ 0.8). h. Distribution of the number of CoS per gene; only 0.8% genes harbor more than four colocalized sets. i. For each gene with multiple CoS, we consider a pair of primary CoS and secondary CoS, and evaluate the number of brain cell type pseudo-bulk eQTLs showing shared effects for each CoS in the pair. We present a heatmap of the number of pairs of primary and secondary CoS for the same gene, showing different patterns of sharing across brain cell type eQTLs. Numerical results are reported in Supplementary Data.
Figure 4.
Figure 4.. Validation of ColocBoost colocalization signals using CRISPR data.
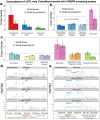
a. Variant set-level excess-of-overlap (EOO) analysis of (i) 95% CoS-gene links from xQTL-only ColocBoost, (ii) standard marginal xQTL-gene associations (FDR<0.05), merged across all 17 xQTL datasets and (iii) 95% credible set (CS)-gene links from SuSiE fine-mapping, merged across all 17 xQTL datasets (Methods), against 569 silver-standard element-gene links from 3 aggregated CRISPR interference (CRISPRi) datasets in K562 cell line using KRAB-dCas9 protocol (refs), and 8,192 silver-standard element-gene links from the recent STING-seq data in K562 using a newer KRAB-dCas9-MeCP2 protocol (ref). b, c. Relative EOO analysis of 95% CoS-gene links across b. 3 different brain cortical regions and CD14+CD16- bulk monocytes, and c. 6 different brain cell types, against element-gene links from aggregated CRISPR (dCas9) and STING-seq datasets. Red asterisks denote significant enrichment based on EOO test adjusted for multiple testing (Bonferroni adjusted p-value<0.05). d. As an illustration, a CoS-gene link from microglia-specific eQTL colocalization in FCGR2A is validated by CRISPRi in K562 cells. e. A second CoS-gene link, reflecting colocalization between monocyte eQTLs and bulk brain region data at the SUOX gene, is similarly validated by CRISPRi in K562 cells. The green box denotes the CRISPRi enhancer linked to the target gene. Numerical results are reported in Supplementary Data.
Figure 5.
Figure 5.. Disease heritability analyses of variant-level functional annotations derived from ColocBoost.
a. We generated 5 MaxVCP variant-level functional annotation scores by performing xQTL-only ColocBoost (Results) and performed S-LDSC heritability analysis of the resulting annotations. (i) Heritability enrichment conditional on 97 baseline-LD v2.2 annotations. (ii) Standardized effect sizes of the 5 MaxVCP scores, each conditional on 97 baseline-LD v2.2 annotations (marginal τ). (iii) Standardized effect sizes, jointly analyzing 97 baseline-LD v2.2 annotations and all 5 MaxVCP scores (joint τ). b. Standardized effect sizes of the MaxVCP-xQTL and an analogous score based on the HyPrColoc method in a joint model involving other 97 baseline-LD v2.2 annotations. All results are meta-analyzed across 57 complex traits as well as subsets of 18 brain-related and 22 blood-related traits following from S-LDSC recommendations. The asterisks indicate statistical significance (Bonferroni adjusted p<0.05). Error bars indicate 95% confidence intervals. Numerical results are reported in Supplementary Data.
Figure 6.
Figure 6.. AD–xQTL ColocBoost identifies colocalized variants between xQTLs and AD GWAS.
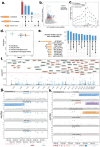
a. UpSet plot of distinct (i) 95% CoS identified by GWAS–xQTL ColocBoost, (ii) union of 95% CoS identified by applying COLOC on each xQTL with AD GWAS (COLOC-union), and (iii) 95% SuSiE credible sets (CS) from AD GWAS fine-mapping. b. Scatter plot across variants comparing the marginal association z-scores in AD GWAS against the quantile-matched z-scores corresponding to the strongest marginal association signals (in terms of the magnitude of z-scores) across all xQTL traits for each CoS. We color-code variants within CoS corresponding ColocBoost, COLOC-union and both methods. c. Distribution of distances from the gene TSS for CoS from AD–xQTL ColocBoost, COLOC-union, and the union of CoS identified by ColocBoost applied pairwise to one AD GWAS and each of xQTL traits (pairwise-ColocBoost-union). d. Precision-recall analysis comparing CoS-gene links from AD-xQTL ColocBoost, COLOC-union, pairwise-ColocBoost-union, and a version limiting AD-xQTL ColocBoost to AD fine-mapped variants (ColocBoost-Finemapped-GWAS) against enhancer-gene links predicted by ENCODE-rE2G across 354 biosamples. Error bars along both axis indicate 95% confidence intervals. e. An UpSet plot focusing showing the distinct colocalization patterns across xQTLs exhibited by 95% CoS from AD-xQTL ColocBoost. f. Manhattan plot of variant level MaxVCP from ColocBoost, with labeled genes containing variants with MaxVCP>0.5 and highlighting microglia contributions (green). g. An example case of AD-xQTL colocalization demonstrating a single CoS with cell-type specific colocalization in microglia for BLNK gene. h. A second example case of AD-xQTL colocalization demonstrating three distinct CoS showing different colocalization patterns across multiple brain cell types for the CTSH gene. Numerical results are reported in Supplementary Data.

Similar articles

References

    1. Bryois J. et al. Cell-type-specific cis-eQTLs in eight human brain cell types identify novel risk genes for psychiatric and neurological disorders. Nature neuroscience 25, 1104–1112 (2022). - PubMed
    1. Currin K.W. et al. Genetic effects on liver chromatin accessibility identify disease regulatory variants. The American Journal of Human Genetics 108, 1169–1189 (2021). - PMC - PubMed
    1. Hormozdiari F., Kostem E., Kang E.Y., Pasaniuc B. & Eskin E. Identifying causal variants at loci with multiple signals of association. in Proceedings of the 5th ACM Conference on Bioinformatics, Computational Biology, and Health Informatics 610–611 (2014). - PMC - PubMed
    1. Huan T. et al. Genome-wide identification of DNA methylation QTLs in whole blood highlights pathways for cardiovascular disease. Nature communications 10, 4267 (2019). - PMC - PubMed
    1. McRae A.F. et al. Identification of 55,000 replicated DNA methylation QTL. Scientific reports 8, 17605 (2018). - PMC - PubMed

Publication types

LinkOut - more resources