[Preprint]. 2025 May 11:2025.05.09.25327043.
doi: 10.1101/2025.05.09.25327043.

Single cell multiomics reveals drivers of metabolic dysfunction-associated steatohepatitis

Affiliations

Single cell multiomics reveals drivers of metabolic dysfunction-associated steatohepatitis

Weston Elison et al. medRxiv. .

Abstract

Metabolic dysfunction-associated steatotic liver disease (MASLD) has limited treatments, and cell type-specific regulatory networks driving MASLD represent therapeutic avenues. We assayed five transcriptomic and epigenomic modalities in 2.4M cells from 86 livers across MASLD stages. Integrating modalities increased annotation of the genome in liver cell types several-fold over previous catalogs. We identified cell type regulatory networks of MASLD progression, including distinct hepatocyte networks driving MASL and mild and severe fibrosis MASH. Our single cell atlas annotated 88% of MASH-associated loci, including a third affecting hepatocyte regulation which we linked to distal target genes. Finally, we characterized hepatocyte heterogeneity, including MASH-enriched populations with altered repression, localization, and signaling. Overall, our results provide high-resolution maps of liver cell types and revealed novel targets for anti-MASH therapy.


Conflict of interest statement

Competing interests: K.J.G. has done consulting for Genentech, holds stock in Neurocrine biosciences, and has received honoraria from Pfizer. B.R. is a co-founder of Epigenome Technologies and has equity in Arima Genomics inc. R.M.E. is an employee and shareholder of Pfizer.

Figures
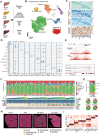
Figure 1.
Figure 1.. Integrated cell type-specific map of gene regulation in the human liver.
(A) Study design consisting of profiling normal, MASL, MASH and MetALD livers from 86 human donors. Within MASH and MetALD livers were further classified by low fibrosis (Fib−) and high fibrosis (Fib+). Each donor was assayed using single cell multiome (paired ATAC-seq and RNA-seq), Paired tag for H3K27ac and H3K27me3 marks (paired Cut&Tag and RNA-seq), droplet Hi-C and genome-wide genotyping. A subset of donors was also assayed using spatial transcriptomics (Visium) (B) UMAP plot showing clustering of 678,748 nuclei from multiome, Paired-Tag and droplet Hi-C. Clusters are labeled based on cell type identity which is defined using gene expression of key marker genes. (C) Activity of selected cell type marker genes across liver cell types in gene expression, ATAC-seq, H3K27ac and H3K27me3 profiles. (D) Genome browser locus plots of selected cell type marker genes across liver cell types in ATAC-seq, H3K27ac and H3K27me3 profiles. (E) Chromatin contacts from Hi-C at the ADAMTS2 locus in HSCs (blue) and endothelial (red) cells. Bottom shows the ATAC-seq, H3K27ac and H3K27me3 profiles in HSCs and endothelial cells for the same genomic region. (F) Liver cell type proportions (top), number of cells from each assay (middle), and MASLD phenotypes (bottom) across all 86 donors profiled in the study. (G) Proportions of each liver cell type across fibrosis stages (top) and MASLD state (bottom). (H) Cell type annotations in spatial imaging of representative normal, MASL, Fib− MASH and Fib+ MASH livers. We note that the colors denoting each cell type differ from the rest of the figure for the purposes of visualization of the spatial profiles. (I) Expression of selected marker genes of liver cell types in spatial profiles.
Figure 2.
Figure 2.. Cell type-specific gene regulatory programs in the human liver.
(A) Percentage of liver cell type cCREs in this study identified in the liver in ENCODE and HEA (top), and distribution of liver cell type cCREs across various genomic features (B) Emission probabilities of ATAC-seq, H3K27ac and H3K27me3 for each chromatin state (active, open, weak, repressive, and unknown) and proportion of the genome annotated with each state in each cell type (top), and distribution of chromatin states in hepatocytes genome-wide (bottom left) and at cCREs (bottom right). (C) Examples of gene regulatory networks (GRNs) with hepatocyte-specific and myeloid-specific cCRE-target gene links and active chromatin state at the CRP and CD163 loci, respectively. Chromatin contacts in hepatocytes and myeloid cells support cell type-specific activity at each locus. Hepatocyte cCRE-target gene links from GRNs show enrichment of chromatin contacts compared to proximal regions, while myeloid target genes links show no enrichment. (D) Clustering of liver cell type cCREs into modules (M0–8) based on accessibility profiles across cell types (left) and chromatin state of cCREs in each module across cell types (right). (E) Enrichment of chronic alanine aminotransferase (cALT) level associated variants in cCREs and H3K27ac sites in each liver cell type (left), enrichment of cALT associated variants in cCREs annotated in each chromatin state in hepatocytes and cholangiocyte (top right), and number of fine-mapped cALT loci and variants overlapping hepatocyte cCREs and active chromatin states. Colors represent the posterior probability (PPA) of variants. (F) Liver cell type cCREs with accessibility profiles highly specific to a cell type. Plotted values represent log scaled counts-per-million (CPM) in the cCRE. (G) Transcription factor sequence motifs enriched in cCREs with cell type-specific accessibility for each cell type. (H) Expression level of genes in each cell type linked to cCREs with cell type-specific accessibility (left), and biological pathways enriched in genes linked to specific cCREs in each cell type (right).
Figure 3.
Figure 3.. Cell type-specific genomic and epigenomic changes in MASLD.
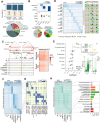
(A) Number of genomic features in each cell type for each modality with significant changes in activity in different MASLD stages compared to normal livers. (B) Pearson correlation in fold-change in hepatocyte activity in high fibrosis (Fib+) MASH across modalities (left), and genome browser plot of the DTNA locus where, in Fib+ MASH, several cCREs had increased accessibility and H3K27ac signal, DTNA had increased expression, and the region had broadly reduced H3K27me3 signal. (C) Biological pathways in hepatocytes with altered expression in MASLD stages compared to normal livers. Values shown in the heatmap are normalized enrichment scores (NES) and cells contain a * if the NES were significant at FDR<.10 (top), and correlation in the fold-change of gene expression levels in hepatocytes in MASL compared to Fib− and Fib+ MASH (bottom). (D) Clusters of hepatocyte cCREs with significant change in Fib+ MASH across different MASLD stages in ATAC-seq, H3K27ac and H3K27me3 profiles (top), and transcription factor sequence motifs enrichments for cCREs in each cluster (bottom). (E) Chromatin state in each MASLD stage for hepatocyte cCREs with decreased activity in MASH (top) and increased activity in MASL/MASH (bottom). (F) Genome browser tracks showing example loci with altered activity in hepatocytes in MASH. A hepatocyte cCRE in the GOLGA1 gene (highlighted in black rectangle) with decreased activity in higher fibrosis and in an active hepatocyte chromatin state shows physical interactions via chromatin looping with the promoter region of the SCAI gene, which has decreased expression higher fibrosis (top); A hepatocyte cCRE in the SNX27 gene (highlighted in black rectangle) with decreased activity in higher fibrosis and in an active hepatocyte chromatin state shows physical interactions via chromatin looping with the promoter region of the RORC gene, which has decreased expression higher fibrosis (bottom). (G) Transcription factor gene regulatory networks (GRNs) in hepatocytes with increased or decreased activity in MASLD stages compared to normal livers. GRNs are grouped (GRN c1–6) based on change in activity across MASLD stages. Cells with significant (FDR<.10) change in GRN activity are highlighted with * (left), and biological pathways significantly (FDR<.10) enriched among genes in each GRN (right). (H) Connectivity of GRNs with altered activity in Fib− MASH, Fib+ MASH and MASL. Transcription factor genes as well as the genes in GRNs for each factor are colored based on the change in expression in the specified MASLD stage. (I) Fold-enrichment of fine-mapped MASLD (cATL) associated variants for hepatocyte GRNs in each GRN group compared to background cCREs (top), and connectivity of hepatocyte GRNs based on fine-mapped MASLD variants overlapping a cCRE in the GRN. Colors are based on the clustering of GRN connectivity using igraph. *FDR<.10
Figure 4.
Figure 4.. MASLD risk loci affect hepatocyte gene regulatory programs.
(A) Number of features for each modality with a significant (FDR<.10) QTL in each liver cell type. (B) Transcription factor sequence motifs enriched in chromatin and H3K27ac QTLs for each cell type. *FDR<.10. (C) Proportion of QTLs in each cell type for each modality which are colocalized with QTLs for another modality or not colocalized with any other QTLs (top), and proportion of QTLs in each modality that are shared across cell types or show cell type specificity. (D) Number of MASLD-associated loci that are significant QTLs for each modality and colocalize with QTLs for each modality in hepatocytes. (E) Annotation of specific MASLD loci with QTL association including loci with a fine-mapped variant overlapping a cCRE or active chromatin state, a fine-mapped variant with predicted effects on hepatocyte chromatin with chromBPnet, and a link to a predicted target gene. (F) MASLD-associated variants at the 12q13 locus affect activity of a cCRE in hepatocytes, where the risk allele A has increased chromatin accessibility and H3K27ac activity (top left) and has higher predicted accessibility and maps in a sequence motif for HNF1A (bottom left). The MASLD association signal was strongly colocalized with chromatin accessibility and H3K27ac QTL association for the cCRE (highlighted in grey) in hepatocytes, and the cCRE region showed physical interactions in hepatocytes with the KRT8 and KRT18 promoter regions (right). (G) MASLD-associated variants at the 8p23 locus affect activity of a cCRE in hepatocytes, where the risk allele A has decreased chromatin accessibility and H3K27ac activity (top left) and has lower predicted accessibility and maps in a sequence motif for HNF1A (bottom left). The MASLD association signal was strongly colocalized with chromatin accessibility QTL association for the cCRE (highlighted in grey) in hepatocytes, and the cCRE region showed physical interactions in hepatocytes with the PPP1R3B promoter regions (right).
Figure 5.
Figure 5.. Heterogeneity in hepatocytes and changes in MASLD.
(A) Subclusters of hepatocytes identified in single cell multiome and Paired-Tag data including zone 1 (peri-portal), zone 2 (mid-lobular), zone 3 (peri-central) populations, a MASH-associated (MASH-a) population, and a Fibrosis-associated (Fib-a) population. (B) Genes with specific expression in each hepatocyte sub-cluster (left) and biological pathways enriched in subcluster-specific genes (right). (C) Annotation of hepatocyte sub-clusters in spatial transcriptome profiles from representative examples of normal, MASL, Fib− MASH and Fib+ MASH livers. (D) Proportions of cells in hepatocyte subclusters across different MASLD states and fibrosis score. (E) Hepatocyte cCREs with activity specific to each sub-cluster in accessible chromatin, H3K27ac and H3K27me3 profiles (left) and TF sequence motifs enriched in subcluster-specific cCREs (right). (F) TF GRNs with increased activity in each hepatocyte sub-cluster. (G) Features for each modality with changes in activity in MASLD states within each hepatocyte sub-cluster (top) and the proportion of bases within H3K27me3 bins altered in injured hepatocytes in Fib+ MASH in each chromatin state (bottom). (H) Biological pathways enriched in H3K27me3 bins with increased and decreased activity in Fib-a hepatocytes in Fib+ MASH (top), and enrichment of cell structure/interaction pathways in Fib+ MASH in each hepatocyte sub-cluster (bottom). (I) Sequence motifs enriched in cCREs with increased activity in Fib+ MASH in each hepatocyte sub-cluster. (J) Pseudo-time ordering of hepatocytes from the Fib-a sub-cluster (left), where Zone 3 hepatocytes are ordered closest to Fib-a cells compared to other hepatocyte zones (top right). Expression of the top genes up-regulated in Fib+ MASH in hepatocytes and proportion of each hepatocyte subcluster across pseudo time bins (bottom right). (K) Cells in spatial transcriptomics of a Fib+ MASH donor colored by the joint expression of the top genes up-regulated in Fib+ MASH. (L) Cellular neighborhood analysis showing enrichment of each liver cell type and hepatocyte sub-cluster for proximity to other cell types. (M) Strength of overall interactions between pairs of liver cell types and hepatocyte sub-clusters based on predicted cell-cell signaling in Fib+ MASH (left), strength of interaction between ligand expressed in HSCs (COL1A1) and specific receptors expressed in liver cell types and sub-clusters in Fib+ MASH (right).

References

    1. Gao B., Bataller R., Alcoholic liver disease: pathogenesis and new therapeutic targets. Gastroenterology 141, 1572–1585 (2011). - PMC - PubMed
    1. Kisseleva T., Brenner D., Molecular and cellular mechanisms of liver fibrosis and its regression. Nat Rev Gastroenterol Hepatol 18, 151–166 (2021). - PubMed
    1. Cederbaum A. I., Alcohol metabolism. Clin Liver Dis 16, 667–685 (2012). - PMC - PubMed
    1. Lieber C. S., Rubin E., DeCarli L. M., Hepatic microsomal ethanol oxidizing system (MEOS): differentiation from alcohol dehydrogenase and NADPH oxidase. Biochem Biophys Res Commun 40, 858–865 (1970). - PubMed
    1. Riazi K., Azhari H., Charette J. H., Underwood F. E., King J. A., Afshar E. E., Swain M. G., Congly S. E., Kaplan G. G., Shaheen A.-A., The prevalence and incidence of NAFLD worldwide: a systematic review and meta-analysis. Lancet Gastroenterol Hepatol 7, 851–861 (2022). - PubMed

Publication types

LinkOut - more resources