[Preprint]. 2025 May 7:2025.04.30.25326597.
doi: 10.1101/2025.04.30.25326597.

Pathogenic variants in BORCS5 Cause a Spectrum of Neurodevelopmental and Neurodegenerative Disorders with Lysosomal Dysfunction

Affiliations

Pathogenic variants in BORCS5 Cause a Spectrum of Neurodevelopmental and Neurodegenerative Disorders with Lysosomal Dysfunction

Niccolò E Mencacci et al. medRxiv. .

Abstract

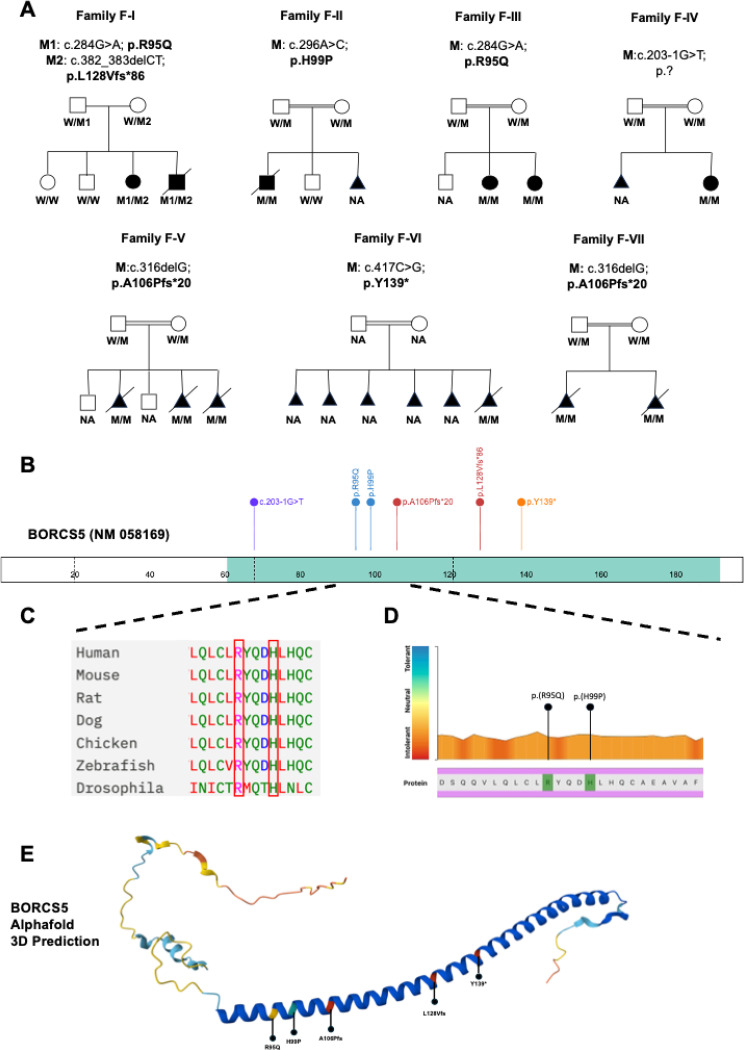
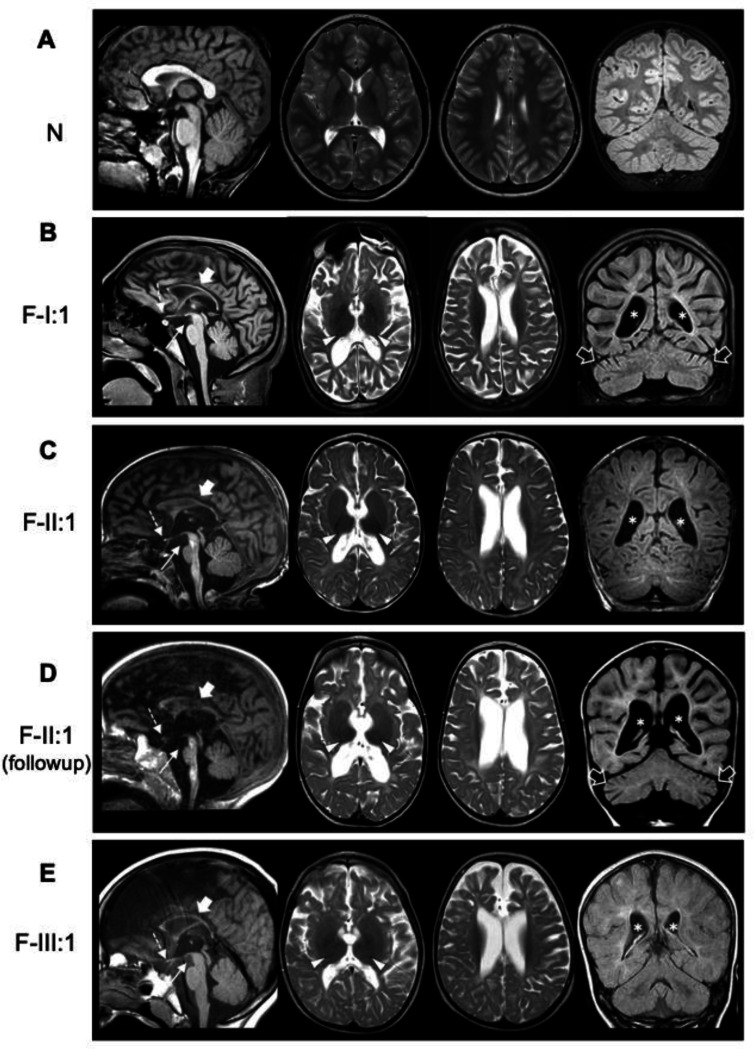
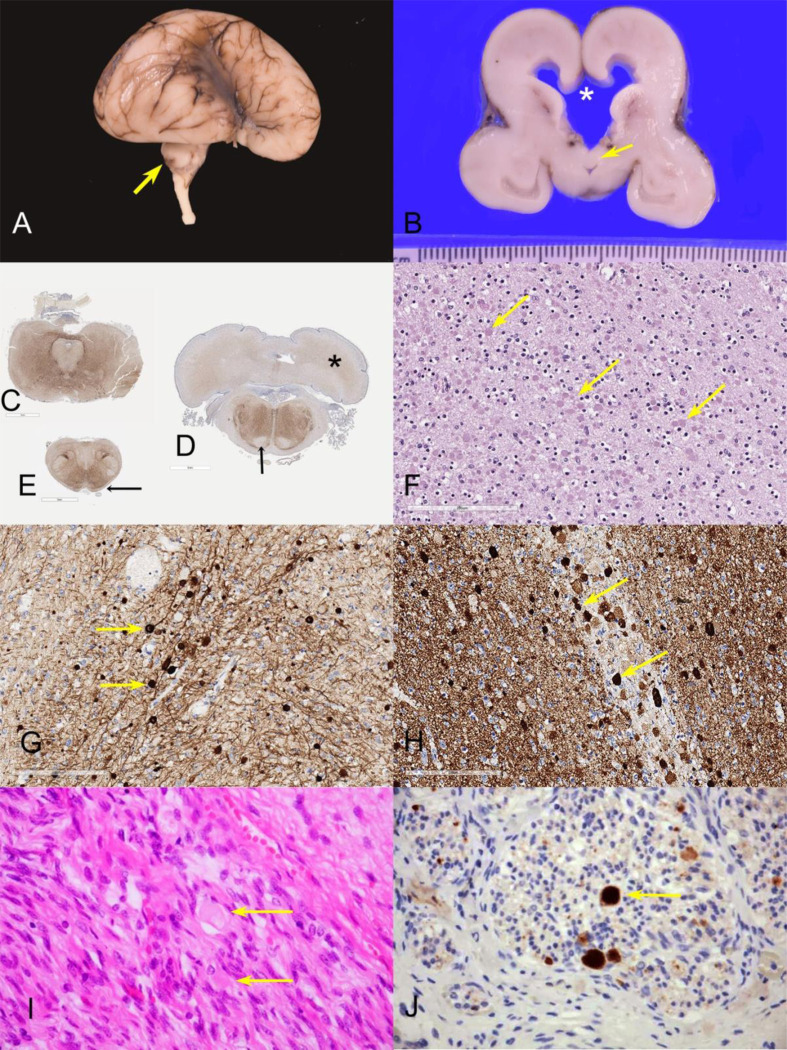
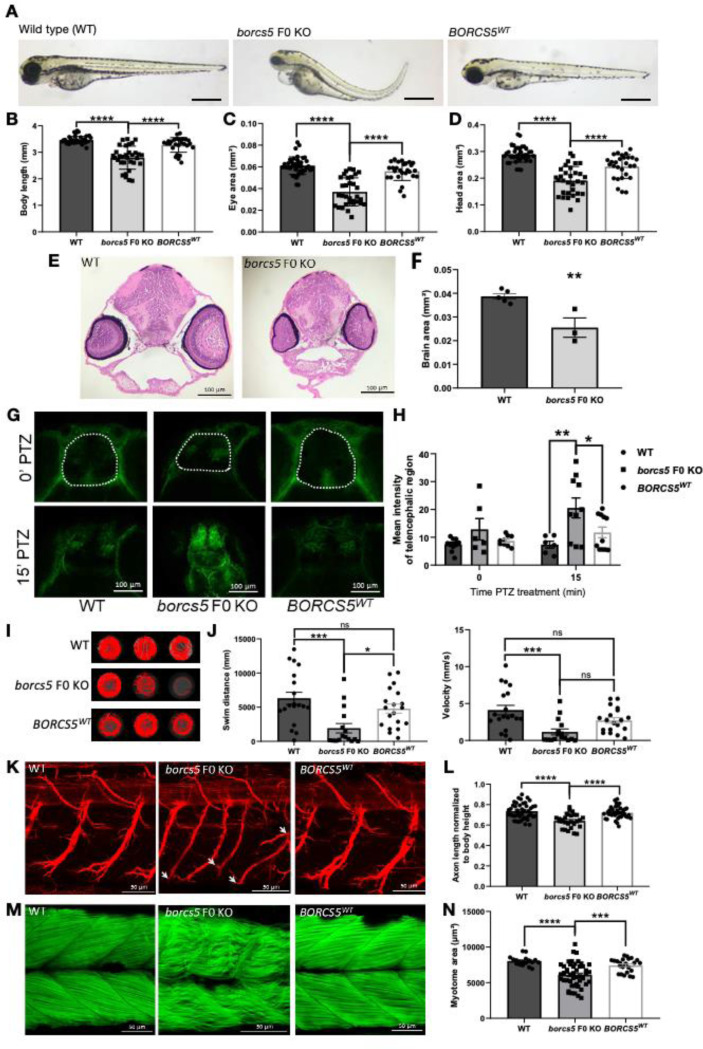
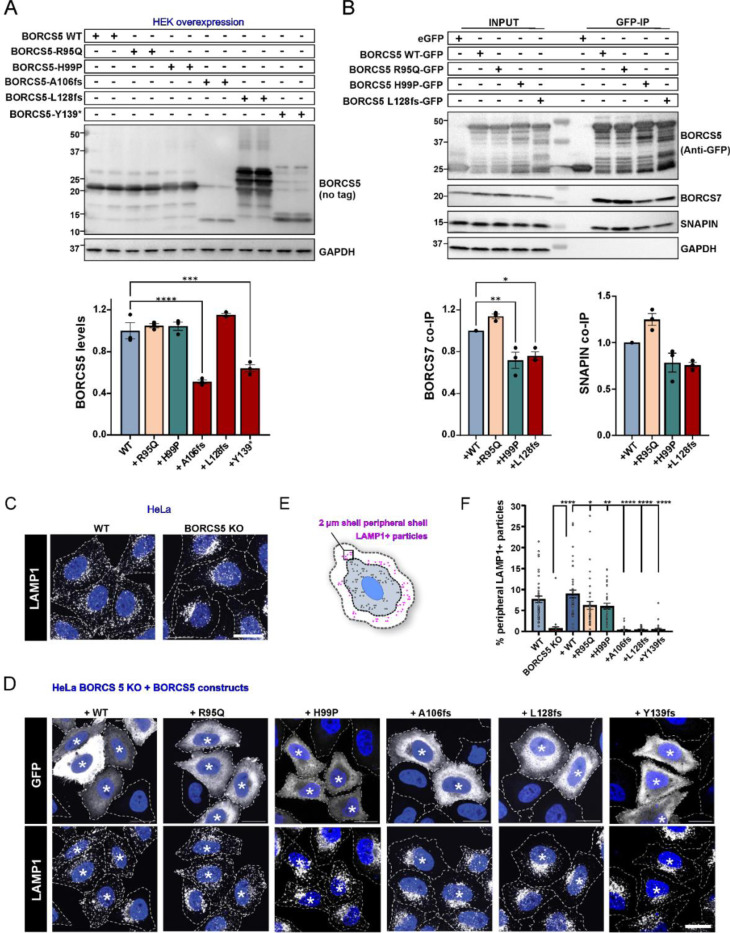
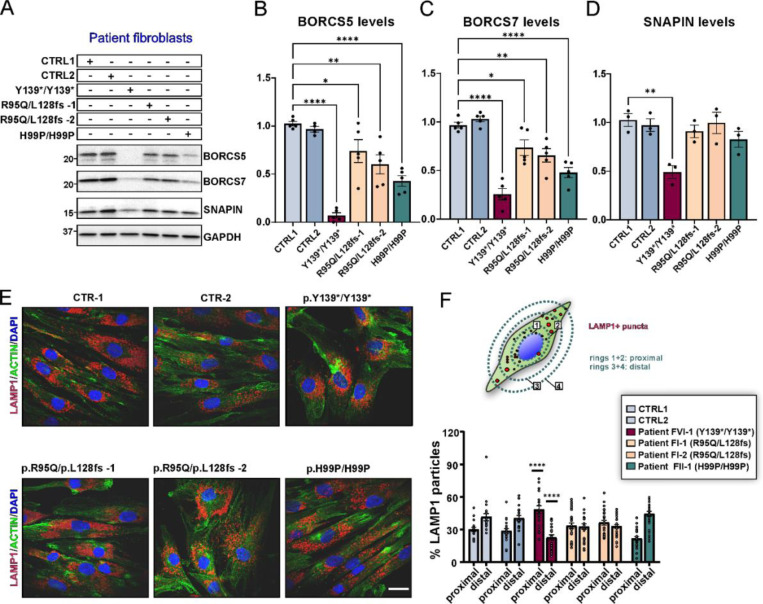
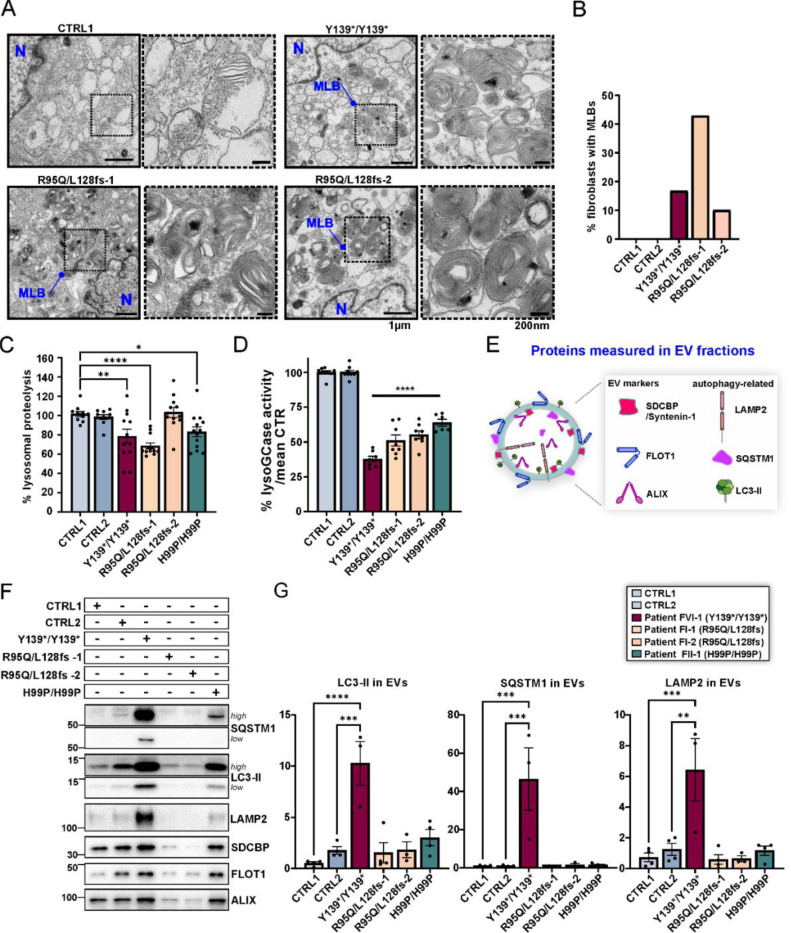
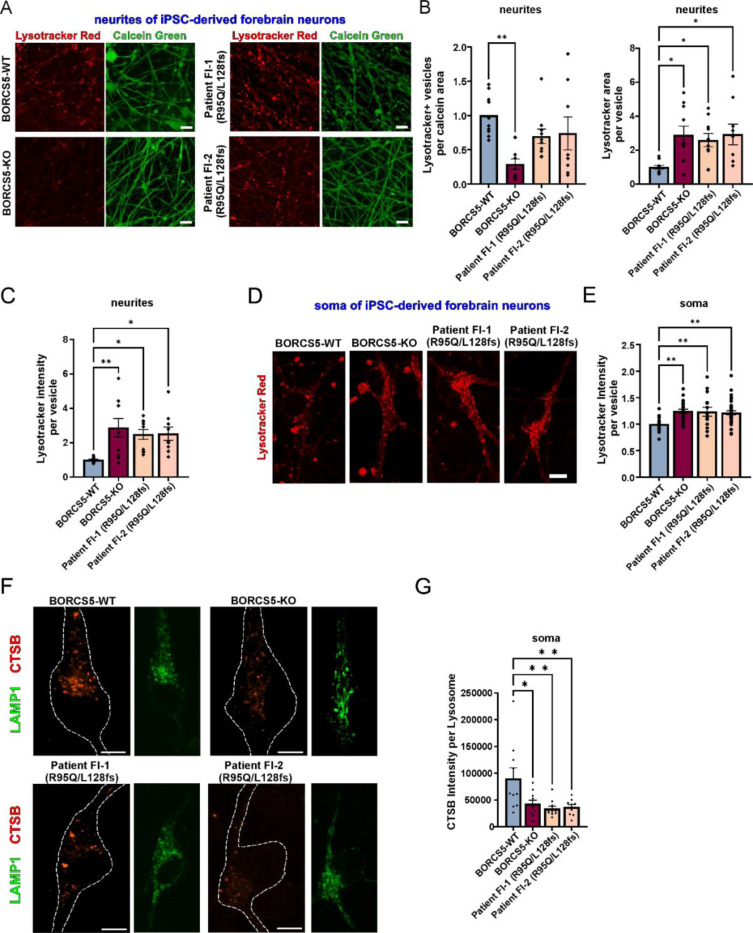
BORCS5 encodes a subunit of the BLOC-one-related complex (BORC), which is known to mediate the kinesin-dependent anterograde movement of lysosomes. Using whole-exome sequencing, we identified 12 cases from seven families carrying bi-allelic BORCS5 variants, including four loss-of-function and two missense variants. Carriers of homozygous loss-of-function variants presented with prenatally lethal arthrogryposis multiplex congenita, brain malformations, and neuropathological evidence of diffuse neuroaxonal dystrophy. Individuals with missense variants presented differently, with microcephaly, developmental epileptic encephalopathy, intellectual disability, optic atrophy, spasticity, and progressive movement disorders. In this group, brain MRI showed diffuse hypomyelination and progressive global cerebral atrophy, consistent with neurodegeneration. Borcs5 knockout in zebrafish exhibited microcephaly, motor deficits, and seizures, mirroring the patients' clinical presentation. At the cellular level, BORCS5 loss-of-function but not missense variants, resulted in lower protein expression and impaired BORC assembly, paralleled by perinuclear lysosomal clustering. However, both loss-of-function and missense BORCS5 variants were associated with reduced total lysosomal proteolysis, reduced activity of the lysosomal hydrolases glucocerebrosidase and cathepsin B, and presence of multilamellar bodies, indicating lysosomal dysfunction. Our study reveals a novel role for BORCS5 in the regulation of lysosomal function, in addition to its known role in the anterograde movement of lysosomes, possibly underlying the diverse clinical manifestations in individuals with BORCS5-related disorders.


Conflict of interest statement

Niccolò E. Mencacci receives NIH funding (1K08NS131581) and is supported by the Align Science Across Parkinson’s (ASAP) Global Parkinson’s Genetics Program (GP2). He is a member of the steering committee of the PD GENEration study for which he receives an honorarium from the Parkinson’s Foundation. Francesca Magrinelli is supported by the NIHR UCLH Biomedical Research Centre (BRC) Translational Neuroscience Intermediate Clinical Fellowship (Grant ID: BRC1287/TN/FM/101410), the Edmond J. Safra Movement Disorders Research Career Development Award (Grant ID: MJFF-023893), Parkinson’s UK (Grant ID: G-2401), the American Parkinson Disease Association (Grant ID: 1282403) and the David Pearlman Charitable Foundation. Ingrid M Wentzensen is an employee of and may own stock in GeneDx, LLC. Kailash Bhatia has received grant support from the Edmond J. Safra Movement Disorders Research Career Development Award (Grant ID: MJFF-023893), Parkinson’s UK (Grant ID: G-2401), EPSRC, and the David Pearlman Charitable Foundation. He has received a stipend from the international Parkinson’s disease and Movement Disorders Society as editor of MDCP journal and book royalties from Oxford University Press. Dimitri Krainc is the Founder and Scientific Advisory Board Chair of Lysosomal Therapeutics Inc. and Vanqua Bio. He also serves on the scientific advisory boards of The Silverstein Foundation, Intellia Therapeutics, AcureX, and Prevail Therapeutics and is a Venture Partner at OrbiMed.

Figures

Figure 1.
Figure 1.
Family pedigrees and bi-allelic BORCS5 variants. A. Family pedigrees and genotypes of cases with bi-allelic BORCS5 variants. Triangles indicate spontaneous miscarriages, while crossed triangles indicate elective pregnancy terminations. B. Schematic of BORCS5 protein indicating the position of the identified pathogenic BORCS5 variants. C. Conservation across species of the amino acid residues involved by the identified pathogenic missense variants R95Q and H99P. D. Graphic representation of intolerance to BORCS5 variants. Using the Metadome software (https://stuart.radboudumc.nl/metadome/), we mapped the identified missense variants, which both affect amino acid residues that show significant intolerance to their variation. E: Structure of BORCS5 predicted by AlphaFold and localization of coding variants identified in this study.
Figure 2.
Figure 2.
Neuroimaging findings in cases with BORCS5 missense variants. Brain MRI studies of a control subject (A) for comparison individuals F-I:1 (B), F-II:1 in the first year of life (C) and 1 year later (D), and F-III:1 (E); sagittal T1-weighted images (first column), axial T2-weighted images (second and third column), and coronal FLAIR or T1-weighted images (last column). There is moderate to severe cerebral atrophy and loss of white matter volume with consequent ventricular dilatation in all subjects (asterisks). The myelination is markedly reduced/incomplete in all cases. The corpus callosum is very thin in all individuals (thick arrows) with associated hypoplastic anterior commissure. There is atrophy of the optic nerves (not shown) and chiasm (dashed arrows) in all patients. The thalami are small and hypointense on T2-weighted images (arrowheads). The midbrain and pons are small in all individuals (thin arrows), especially FII:1. Mild atrophy is noted in F-I:1 and F-II:1 (empty arrows). Note the clear progression of cerebral and cerebellar atrophy with arrested myelination in FII:1.
Figure 3.
Figure 3.
Pathological characterization of cases with bi-allelic loss-of-function BORCS5 variants. A: Brain of case F-VII:1 demonstrating hypoplastic temporal lobes, a delayed, smooth Sylvian fissure and a markedly hypoplastic cerebellum (arrow), B. Coronal section, demonstrating ventriculomegaly. The corpus callosum is reduced to a thin membrane and has ruptured (asterisk). The septum is ruptured, and the fornices (arrow) are descended and lie on the roof of the third ventricle. C-D-E: Immunohistochemistry for neurofilament light chain in whole mounts of posterior fossa structures showing: midbrain with minute aqueduct and hypoplastic cerebral peduncles (C); the caudal pons with very small and smooth inferior olivary nuclei, hypoplastic middle cerebellar peduncles, absent corticofugal tracts (arrow) and poorly defined dentate nuclei (asterisk) (D); absent pyramids (arrows) and inferior cerebellar peduncles in the medulla (E). F-G-H: Histological analysis of the same case with hematoxylin and eosin and immunohistochemistry demonstrating innumerable pale eosinophilic axonal spheroids (arrows) in the internal capsule (F); strong positive staining of the axonal spheroids for neurofilament light chain (G) and alpha-synuclein (H). I-J: Peripheral nerves of Case F-V:2 demonstrated numerous axonal spheroids (arrows) (I), which stained strongly positive for β-amyloid precursor protein (J).
Figure 4:
Figure 4:. Zebrafish borcs5 F0 KO larvae exhibit developmental defects and recapitulate patient symptoms.
A. Morphology of zebrafish wild-type (WT), borcs5-ko and larvae injected with human BORCS5 mRNA (BORCS5WT) at 3 days post-fertilization (dpf). Scale bars: 500 μm. B-D. Phenotypes observed for WT, borcs5-ko and BORCS5WT. Body length (B), eye size (C), and head size (D) of WT (n=40), borcs5-ko (n=32) and BORCS5WT (n=26–28) larvae at 3 dpf. E. H&E staining of midbrain sections of 3 dpf WT and borcs5-ko larvae. Scale bar: 100 μm. F. Quantification of brain area of WT (3 dpf, N=5) and borcs5-ko larvae (3 dpf, N=3). G, H. Neuronal activity induced by PTZ treatment (3 mM; 0, 15 min) in 4-dpf larvae was analyzed by quantification of mean intensity fluorescence of p-MAPK/ERK staining (surround in white). A significant increase in borcs5-ko (n=6–10) larvae compared to WT (n=6–10) and BORCS5WT (n=9–11) at 15 min treatment of PTZ was observed. Scale bars: 100 μm I. Representative swim trajectories of WT, borcs5-ko and BORCS5WT larvae at 5 dpf. (J) Quantification of swim distance and velocity in WT (n=19), borcks5-ko (n=16) and BORCS5WT (n=19). K. Acetyl tubulin staining of primary motor axon in WT, borcs5-ko and BORCS5WT larvae at 3 dpf. Scale bars: 50 μm. Defects in axon branching in borcs5-ko larvae are indicated by white arrows. L. Axon length normalized by body height in WT (n=10), borcs5-ko (n=6) and BORCS5WT (n=10). M. Muscle fibers visualized by phalloidin staining at 3 dpf. Scale bars: 50 μm. N. Quantification of dorsal or ventral myotome area between WT (n=9), borcs5-ko (n=10) and BORCS5WT larvae (n=12). All data are represented as the mean ± SEM. Statistical significance was calculated by One-way ANOVA followed by Tukey’s multiple comparisons tests, or Student’s T-test. *P < 0.05; **P < 0.01; ***P < 0.001; ****P < 0.0001; ns = not significant. n represents number of fish; N represents number of experimental repeats.
Figure 5:
Figure 5:. Impact of BORCS5 variants on BORCS5 protein expression, BORC assembly and endolysosome distribution in cell lines.
A. Western blot analysis of BORCS5 protein in HEK293T cells transiently expressing the indicated BORCS5 WT or BORCS5 patient variants. GAPDH was used as a loading control. Quantification graph shows mean±SEM, N=3 independent experiments. Statistics: One way ANOVA with Dunnett’s post hoc (relative to WT construct), FBORCS5(5,12)=41.57, P<0.0001. ****p<0.0001, ***p=0.0002. B. Immunoprecipitation (IP) of GFP-tagged BORCS5 variants and their interaction (co-IP) with endogenous SNAPIN and BORCS7. GAPDH was used as a specificity control. Graph shows mean±SEM, N=3 independent experiments. Statistics: One way ANOVA with Dunnett’s post hoc (relative to WT construct), FBORCS7(3,8)=19.70, P=0.0005. **p=0.0055, *p=0.0136. FSNAPIN(3,8)=13.61, P=0.0017. C-D. Immunofluorescence microscopy shows endogenous LAMP1 (white puncta) distribution in untransfected WT and BORCS5 KO HeLa cells as a control. BORCS5-KO HeLa cells were transiently co-transfected with the indicated BORCS5 constructs and GFP. Immunofluorescence microscopy shows endogenous LAMP1 distribution in GFP+ transfected cells (indicated by asterisk). Nuclei were labeled with DAPI (blue), and cell edges were outlined by fluorescent phalloidin (indicated by dashed lines). Scale bars: 20 μm. E. Schematic depicts the analysis performed to quantify the percentage of LAMP1+ endolysosomes present in a 2-μm peripheral shell. F. Quantification shows mean±SEM. Statistics: One-way ANOVA with Dunnett multiple comparisons test (compared to WT construct), Fperipheral lysosomes (7,289)=30.96, P<0.0001, *p<0.05, **p=0.0098, ****p < 0.0001.
Figure 6:
Figure 6:. BORC-related protein expression and endolysosomal distribution in BORCS5 patient fibroblasts.
A. The western blot shows relative levels of BORCS5, SNAPIN and BORCS7 in patient fibroblasts compared to two independent control lines. GAPDH was used as a loading control. B-D. Graphs represent mean±SEM, N=3–5 independent experiments. Statistics: One way ANOVA with Dunnett’s post hoc (compared to CTRL1), FOR CS5(5,23)=24.56, P<0.0001; FBORCS7(5,24)=27.02, P<0.0001; FSNAPIN(5,12)=6.704, P=0.0034, *p<0.03, **p<0.003, ****p<0.0001. E. Immunofluorescence microscopy shows endogenous LAMP1 puncta distribution in control or BORCS5 patient fibroblasts, quantified according to the schematic F. Concentric rings of 1.5 increment were designed using Fiji, using individual nuclei as reference. Puncta within rings 1 and 2, were designated proximal whereas those in rings 3 and 4 were considered distal to the nucleus. Graph represents mean±SEM from N=3 independent experiments. Statistics: Two-way ANOVA FInteraction(5,276)=22.86, P<0.0001, with Šidák post hoc (compared to CTRL and CTRL2).
Figure 7:
Figure 7:. Lysosomal dysfunction in BORCS5 patient fibroblast lines
A. TEM of fibroblasts from the indicated BORCS5 genotypes. Outlined insets are presented at higher magnification on the right, indicated by dashed lines. Abbreviations: N: Nucleus; MLB: Multilamellar body. B. Graph represents the percentage of fibroblasts exhibiting MLBs under TEM with N=9 to 18 individual cells visualized per fibroblast line. C. The efficiency of lysosomal proteolysis was assessed upon administration of 25μg/mL of DQ Green or Red BSA for 5 h, in 10,000 single cell events, via flow cytometry. Graph represents the mean±SEM of the fold change in median fluorescence intensity, normalized to the mean of control lines. CTR-1 and CTR-2: N=9; p.Y139*/p.Y139* and p.R95Q/L128Vfs*86 : N=8; p.H99P/H99P: N=9 independent experiments. Statistics: One way ANOVA with Dunnett’s post hoc (compared to CTRL1). Proteolysis(5,63)=8.687, P<0.0001. ** p=0.007, **** p<0.0001, * p=0.038. D. Lysosomal GCase in control or patient fibroblasts was assessed upon administration of 250μM PFB-FDGlu for 30min, in 10,000 single cell events, via flow cytometry. Graph represents the mean±SEM of the % change in median fluorescence intensity, normalized to the mean of control lines. CTR-1 and CTR-2: N=7; p.Y139*/p.Y139*: N=4, p.R95Q/L128Vfs*86 N=4; p.H99P/H99P: N=3 independent experiments. Statistics: One way ANOVA with Dunnett’s post hoc (compared to CTRL1). FlysoGCase(5,41)=121.3, P<0.0001. **** p<0.0001. E. Summary of proteins analyzed in exosome/extracellular vesicle (EV) fractions isolated from identical volumes of fibroblast conditioned medium via ultracentrifugation. F-G. WB of EVs and quantification of autophagy/lysosome-related markers normalized to controls. Graphs show mean±SEM, N=3–4 independent experiments. Statistics: One way ANOVA with Tukey’s multiple comparisons test (mean of each column compared to the mean of every other column), FLC3-II(5,16)=12.51, P<0.0001. **** p<0.0001, *** p=0.0002; SQSTM1(5,16)=10.65, P=0.0001. *** p=0.0002; FLAMP2(5,16)=8.572, P=0.0004. *** p=0.0007, ** p=0.0017.
Figure 8:
Figure 8:. Lysosome-dispersal activity of patient-specific BORCS5 variants. Increased LysoTracker and decreased lysosomal enzyme activity in neurons with patient-specific BORCS5 variants.
A. Imaging of Lysotracker Red endolysosomes (red) in neurites of live iPSC-derived forebrain neurons (labeled with calcein, green) from WT, isogenic BORCS5-KO or R95Q/L128fs patient iPSC lines. B, C Graphs show mean±SEM, N=3 independent experiments. Statistics: One way ANOVA with Dunnett’s post-hoc. Fvesicle number (3,34)=5.250, P=0.0044; Fvesicle area(3,35)=5.373, P=0.0038; Fsignal intensity(3,35)=4.362, P=0.0104. D. Imaging of Lysotracker Red endolysosomes (red) in the soma of iPSC-derived forebrain neurons from the indicated lines. D. Graph shows mean±SEM, N=3 independent experiments. Statistics: One way ANOVA with Dunnett’s post-hoc. Fsignal intensity(3,87)=5.624, P=0.0014. F. Fluorescence microscopy examination of LAMP1+ stained endolysosomes (green) and cathepsin B (CTSB) activity-derived fluorescent signal (red) in the soma of iPSC-derived forebrain neurons from the indicated lines. G. Graph shows mean±SEM, N=3 independent experiments. Statistics: One way ANOVA with Dunnett’s post-hoc. FCTSB activity soma(3,36)=5.478, P=0.00333. Dots represent individual cells.

Similar articles

  • Biallelic BORCS8 variants cause an infantile-onset neurodegenerative disorder with altered lysosome dynamics.
    De Pace R, Maroofian R, Paimboeuf A, Zamani M, Zaki MS, Sadeghian S, Azizimalamiri R, Galehdari H, Zeighami J, Williamson CD, Fleming E, Zhou D, Gannon JL, Thiffault I, Roze E, Suri M, Zifarelli G, Bauer P, Houlden H, Severino M, Patten SA, Farrow E, Bonifacino JS. De Pace R, et al. Brain. 2024 May 3;147(5):1751-1767. doi: 10.1093/brain/awad427. Brain. 2024. PMID: 38128568 Free PMC article.
  • Phenotypic and genetic spectrum of ATP6V1A encephalopathy: a disorder of lysosomal homeostasis.
    Guerrini R, Mei D, Kerti-Szigeti K, Pepe S, Koenig MK, Von Allmen G, Cho MT, McDonald K, Baker J, Bhambhani V, Powis Z, Rodan L, Nabbout R, Barcia G, Rosenfeld JA, Bacino CA, Mignot C, Power LH, Harris CJ, Marjanovic D, Møller RS, Hammer TB; DDD Study; Keski Filppula R, Vieira P, Hildebrandt C, Sacharow S; Undiagnosed Diseases Network; Maragliano L, Benfenati F, Lachlan K, Benneche A, Petit F, de Sainte Agathe JM, Hallinan B, Si Y, Wentzensen IM, Zou F, Narayanan V, Matsumoto N, Boncristiano A, la Marca G, Kato M, Anderson K, Barba C, Sturiale L, Garozzo D, Bei R; ATP6V1A collaborators; Masuelli L, Conti V, Novarino G, Fassio A. Guerrini R, et al. Brain. 2022 Aug 27;145(8):2687-2703. doi: 10.1093/brain/awac145. Brain. 2022. PMID: 35675510 Free PMC article.
  • Bi-allelic genetic variants in the translational GTPases GTPBP1 and GTPBP2 cause a distinct identical neurodevelopmental syndrome.
    Salpietro V, Maroofian R, Zaki MS, Wangen J, Ciolfi A, Barresi S, Efthymiou S, Lamaze A, Aughey GN, Al Mutairi F, Rad A, Rocca C, Calì E, Accogli A, Zara F, Striano P, Mojarrad M, Tariq H, Giacopuzzi E, Taylor JC, Oprea G, Skrahina V, Rehman KU, Abd Elmaksoud M, Bassiony M, El Said HG, Abdel-Hamid MS, Al Shalan M, Seo G, Kim S, Lee H, Khang R, Issa MY, Elbendary HM, Rafat K, Marinakis NM, Traeger-Synodinos J, Ververi A, Sourmpi M, Eslahi A, Khadivi Zand F, Beiraghi Toosi M, Babaei M, Jackson A; SYNAPS Study Group; Bertoli-Avella A, Pagnamenta AT, Niceta M, Battini R, Corsello A, Leoni C, Chiarelli F, Dallapiccola B, Faqeih EA, Tallur KK, Alfadhel M, Alobeid E, Maddirevula S, Mankad K, Banka S, Ghayoor-Karimiani E, Tartaglia M, Chung WK, Green R, Alkuraya FS, Jepson JEC, Houlden H. Salpietro V, et al. Am J Hum Genet. 2024 Jan 4;111(1):200-210. doi: 10.1016/j.ajhg.2023.11.012. Epub 2023 Dec 20. Am J Hum Genet. 2024. PMID: 38118446 Free PMC article.
  • Two novel cases of biallelic SMPD4 variants with brain structural abnormalities.
    Aoki S, Watanabe K, Kato M, Konishi Y, Kubota K, Kobayashi E, Nakashima M, Saitsu H. Aoki S, et al. Neurogenetics. 2024 Jan;25(1):3-11. doi: 10.1007/s10048-023-00737-5. Epub 2023 Oct 26. Neurogenetics. 2024. PMID: 37882972 Review.
  • Sodium Channelopathies in Human and Animal Models of Epilepsy and Neurodevelopmental Disorders.
    Yamakawa K, Meisler MH, Isom LL. Yamakawa K, et al. In: Noebels JL, Avoli M, Rogawski MA, Vezzani A, Delgado-Escueta AV, editors. Jasper's Basic Mechanisms of the Epilepsies. 5th edition. New York: Oxford University Press; 2024. Chapter 44. In: Noebels JL, Avoli M, Rogawski MA, Vezzani A, Delgado-Escueta AV, editors. Jasper's Basic Mechanisms of the Epilepsies. 5th edition. New York: Oxford University Press; 2024. Chapter 44. PMID: 39637100 Free Books & Documents. Review.

References

    1. Ysselstein D., Shulman J.M. & Krainc D. Emerging links between pediatric lysosomal storage diseases and adult parkinsonism. Mov Disord 34, 614–624 (2019). - PMC - PubMed
    1. Robak L.A. et al. Excessive burden of lysosomal storage disorder gene variants in Parkinson’s disease. Brain 140, 3191–3203 (2017). - PMC - PubMed
    1. Steel D. et al. Loss-of-Function Variants in HOPS Complex Genes VPS16 and VPS41 Cause Early Onset Dystonia Associated with Lysosomal Abnormalities. Ann Neurol 88, 867–877 (2020). - PubMed
    1. Calakos N. & Zech M. Emerging Molecular-Genetic Families in Dystonia: Endosome-Autophagosome-Lysosome and Integrated Stress Response Pathways. Mov Disord 40, 7–21 (2025). - PMC - PubMed
    1. Ballabio A. & Bonifacino J.S. Lysosomes as dynamic regulators of cell and organismal homeostasis. Nat Rev Mol Cell Biol 21, 101–118 (2020). - PubMed

Publication types

LinkOut - more resources