[Preprint]. 2025 May 22:2025.05.05.25327017.
doi: 10.1101/2025.05.05.25327017.

Mapping disease loci to biological processes via joint pleiotropic and epigenomic partitioning

Affiliations

Mapping disease loci to biological processes via joint pleiotropic and epigenomic partitioning

Gaspard Kerner et al. medRxiv. .

Abstract

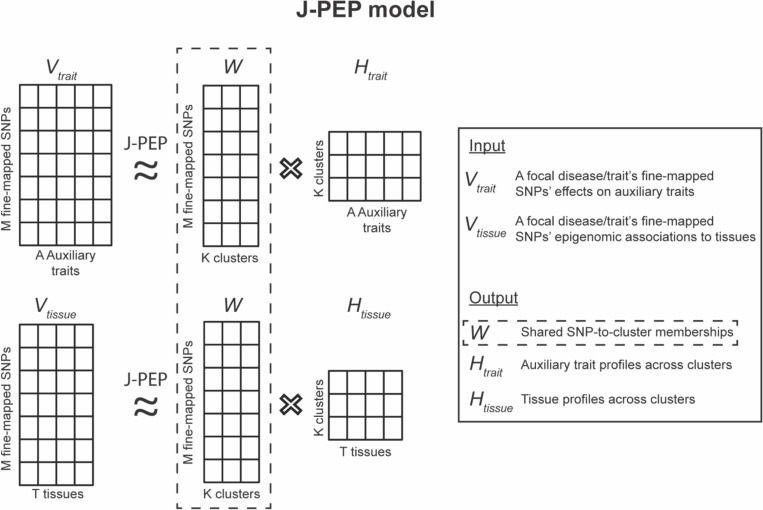
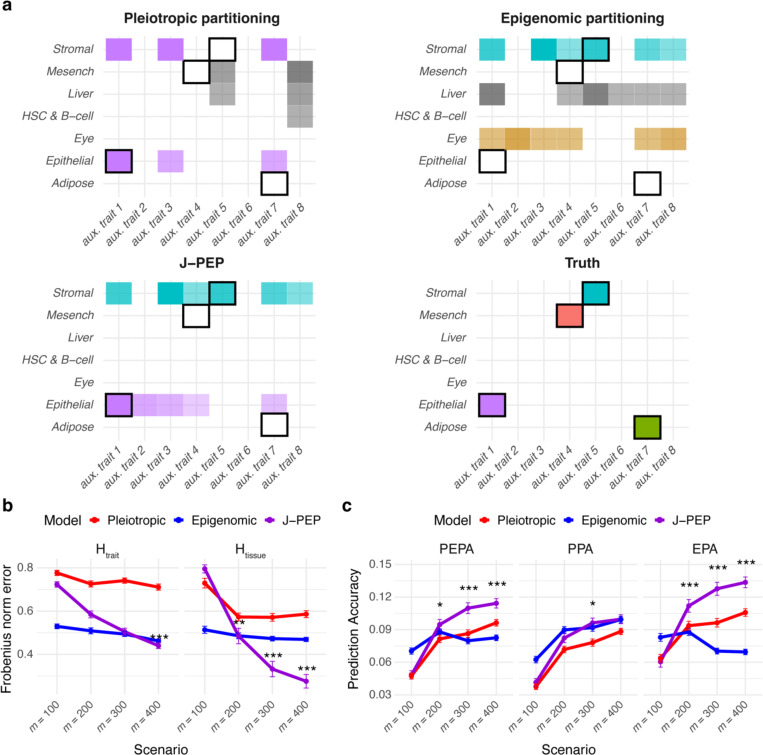
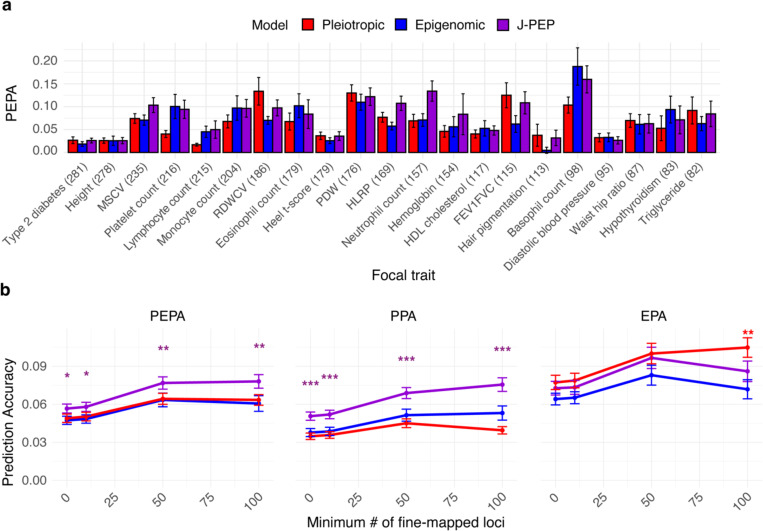
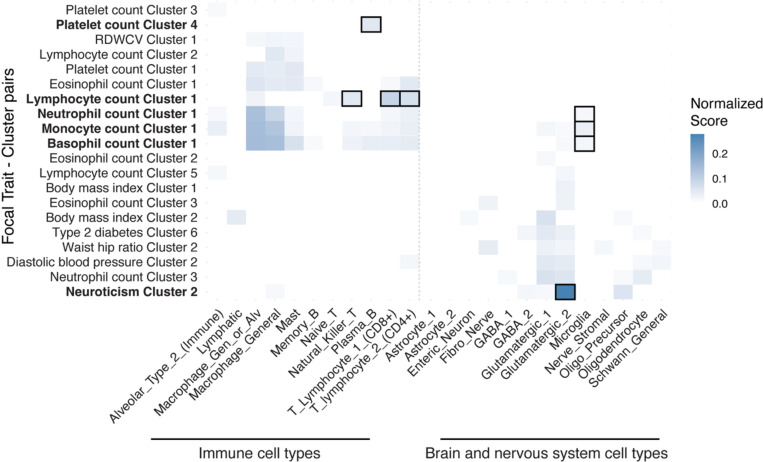
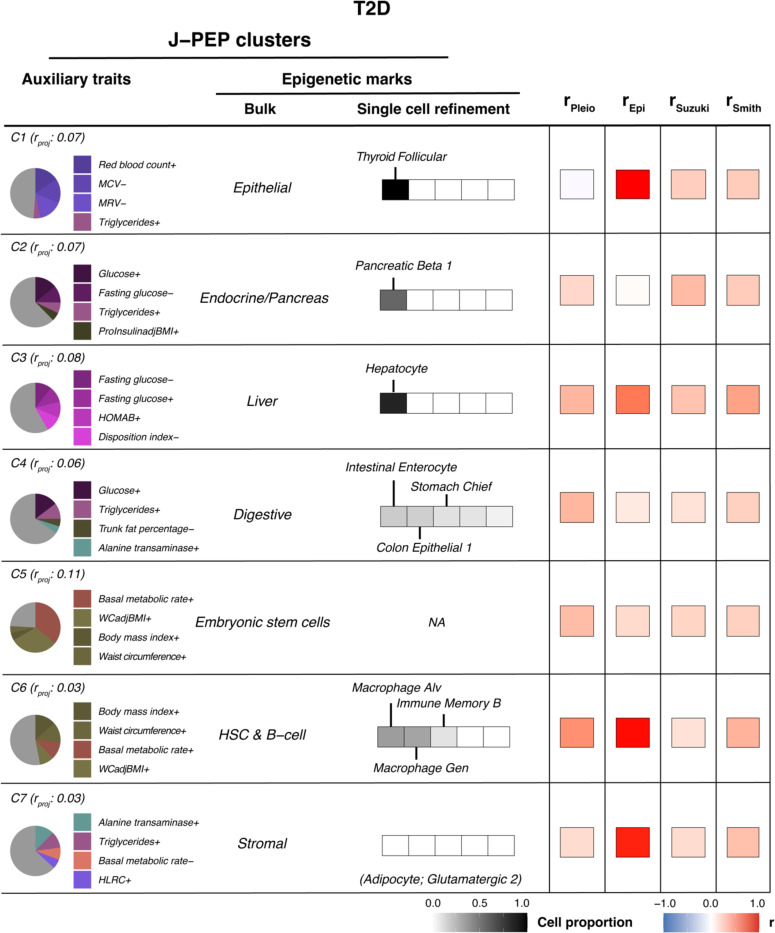
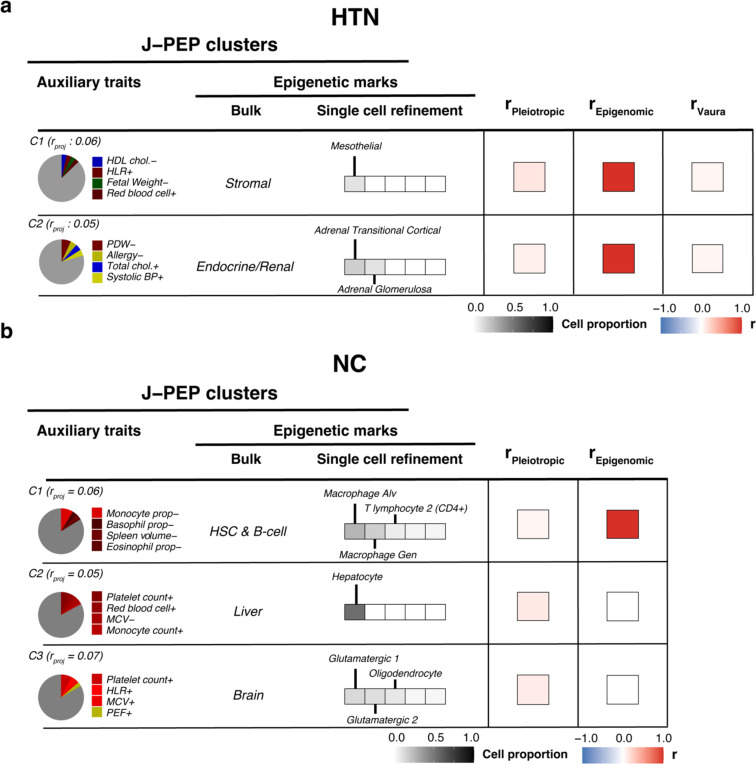
Genome-wide association studies (GWAS) have identified thousands of disease-associated loci, yet their interpretation remains limited by the heterogeneity of underlying biological processes. We propose Joint Pleiotropic and Epigenomic Partitioning (J-PEP), a clustering framework that integrates pleiotropic SNP effects on auxiliary traits and tissue-specific epigenomic data to partition disease-associated loci into biologically distinct clusters. To benchmark J-PEP against existing methods, we introduce a metric-Pleiotropic and Epigenomic Prediction Accuracy (PEPA)-that evaluates how well the clusters predict SNP-to-trait and SNP-to-tissue associations using off-chromosome data, avoiding overfitting. Applying J-PEP to GWAS summary statistics for 165 diseases/traits (average N=290K), we attained 16-30% higher PEPA than pleiotropic or epigenomic partitioning approaches with larger improvements for well-powered traits, consistent with simulations; these gains arise from J-PEP's tendency to upweight correlated structure-signals present in both auxiliary trait and tissue data-thereby emphasizing shared components. For type 2 diabetes (T2D), J-PEP identified clusters refining canonical pathological processes while revealing underexplored immune and developmental signals. For hypertension (HTN), J-PEP identified stromal and adrenal-endocrine processes that were not identified in prior analyses. For neutrophil count, J-PEP identified hematopoietic, hepatic-inflammatory, and neuroimmune processes, expanding biological interpretation beyond classical immune regulation. Notably, integrating single-cell chromatin accessibility data refined bulk-based clusters, enhancing cell-type resolution and specificity. For T2D, single-cell data refined a bulk endocrine cluster to pancreatic islet β -cells, consistent with established β -cell dysfunction in insulin deficiency; for HTN, single-cell data refined a bulk endocrine cluster to adrenal cortex cells, consistent with a GO enrichment for neutrophil-mediated inflammation that implicates feedback between aldosterone production in the adrenal gland and local immune signaling. In conclusion, J-PEP provides a principled framework for partitioning GWAS loci into interpretable, tissue-informed clusters that provide biological insights on complex disease.


Figures

Fig. 1 |
Fig. 1 |. Schematic representation of the J-PEP model.
The J-PEP model performs an extended version of joint Bayesian non-negative matrix factorization (bNMF) to fine-mapped SNPs from a given focal disease/trait. It jointly factorizes two input matrices: a SNP-to-trait matrix Vtrait and a SNP-to-tissue matrix Vtissue. J-PEP infers a shared SNP-to-cluster membership matrix W, an auxiliary trait-to-cluster profile matrix Htrait and a tissue-to-cluster profile matrix Htissue.
Fig. 2 |
Fig. 2 |. J-PEP outperforms Pleiotropic partitioning and Epigenomic partitioning in simulations.
(a) Representative simulation illustrating the output of each method. Each color denotes one true or inferred cluster. Black squares denote causal tissue-auxiliary trait associations of true clusters. (b) Frobenius norm errors between the true vs. inferred auxiliary trait-to-cluster profile matrix Htrait and tissue-to-cluster profile matrix Htissue. (c) PEPA, PPA and EPA prediction accuracy metrics. In (b) and (c), results represent averages across 100 simulation replicates under four simulation settings with 100, 200, 300, or 400 causal SNPs for the focal disease/trait (denoted along the x-axis as m = 100, 200, 300, or 400, respectively). Error bars indicate standard errors across replicates. *: p < 0.05, **: p < 0.01, ***: p < 0.001. Numerical results are reported in Supplementary Table 2.
Fig. 3 |
Fig. 3 |. J-PEP outperforms Pleiotropic partitioning and Epigenomic partitioning in analyses of real diseases/traits.
(a) PEPA prediction accuracy metric for 20 focal diseases/traits with the largest number of fine-mapped loci (denoted in parentheses). Error bars denote standard errors (via genomic block-jackknife). (b) PEPA, PPA and EPA prediction accuracy metrics averaged across 38, 33, 24, or 16 focal traits (of 38 total) with at least 0, 10, 50 or 100 fine-mapped loci, respectively. Error bars denote standard errors (via genomic block-jackknife). *: p < 0.05, **: p < 0.01, ***: p < 0.001 (vs. each other method). Numerical results for all 165 focal diseases/traits are reported in Supplementary Table 3. MSCV: Mean sphered corpuscular volume; RDWCV: Red cell distribution width - coefficient of variation; PDW: Platelet distribution width; HLRP: High light reticulocyte proportion; FEV1FVC: Forced expiratory volume in 1 second/forced vital capacity.
Fig. 4 |
Fig. 4 |. Single-cell data improves resolution and specificity of cell-type associations.
We report normalized cell-type scores for each of 20 selected focal trait-cluster pairs (selected as described below; rows) across 24 single-cell derived immune cell types (left) and brain/nervous system cell types (right). Normalized scores are defined as the proportion of each cluster assigned to a given cell type, normalized across all cell types for that cluster. We selected focal trait-pairs with at least one normalized score >1% and sorted them by identifying the tissue category (immune or brain) with the highest aggregate score for each pair, then sorting first by tissue category and second by the magnitude of the maximum aggregate score within that category. Black borders denote focal trait-cluster-cell-type triplets discussed in the main text, with corresponding focal trait-cluster pairs in bold font. Numerical results for 38 diseases/traits are reported in Supplementary Table 6. RDWCV: Red cell distribution width - coefficient of variation.
Fig. 5 |
Fig. 5 |. Comparison of T2D clusters identified by J-PEP with other clustering methods.
For each T2D cluster identified by J-PEP, the pie chart (left) shows the pleiotropic auxiliary trait profile (top 4 traits), and the bulk and single-cell columns show the associated epigenomic tissue and cell type profiles, respectively. The “+” (resp. “−”) symbol appended to auxiliary trait names denotes pleiotropic associations that are concordant (resp. discordant) with the focal trait (Methods). Single-cell refinement results show the top 5 contributing cell types within the most enriched bulk tissue category, shaded by relative cell proportion. NA indicates that the single-cell atlas that we employed lacks cell types from the implicated bulk tissue. Cell types that do not correspond to a refinement of the implicated bulk tissue are denoted in parentheses. Cluster labels indicate the projection correlation rproj, quantifying internal concordance between trait and tissue profiles (Methods); clusters are ordered by the proportion of total variance they explain jointly across traits and tissues (Methods). The heatmap shows the maximum correlation between each J-PEP cluster and clusters obtained from Pleiotropic partitioning, Epigenomic partitioning, or two previous T2D clustering studies (Smith et al. and Suzuki et al.). See Data Availability for numerical results. MCV: Mean corpuscular volume; MRV: Mean reticulocyte volume; ProInsulinadjBMI: Proinsulin adjusted for body mass index; HOMAB: Homeostasis model assessment of β-cell function; WCadjBMI: Waist circumference adjusted for body mass index; HLRC: High light reticulocyte count.
Fig. 6 |
Fig. 6 |. Comparison of HTN and NC clusters identified by J-PEP with other clustering methods.
For each hypertension (HTN) cluster (a) and neutrophil count (NC) cluster (b) identified by J-PEP, the pie chart (left) shows the pleiotropic auxiliary trait profile (top 4 traits), and the bulk and single-cell columns show the associated epigenomic tissue and cell type profiles, respectively. Single-cell refinement results show the top 5 contributing cell types within the most enriched bulk tissue category, shaded by relative cell proportion. The “+” (resp. “−”) symbol appended to auxiliary trait names denotes pleiotropic associations that are concordant (resp. discordant) with the focal trait (Methods). Cluster labels indicate the projection correlation rproj, quantifying internal consistency between tissue and trait profiles (Methods); clusters are ordered by the proportion of total variance they explain jointly across traits and tissues (Methods). The heatmap shows the maximum correlation between each J-PEP cluster and clusters obtained from Pleiotropic partitioning or Epigenomic partitioning (or Vaura et al. for HTN). See Data Availability for numerical results. HLR: High light reticulocyte count; PDW: Platelet distribution width; BP: Blood pressure; MCV: Mean corpuscular volume; PEF: Peak expiratory flow.

Similar articles

References

    1. Tam V. et al. Benefits and limitations of genome-wide association studies. Nat. Rev. Genet. 20, 467–484 (2019). - PubMed
    1. Shendure J., Findlay G. M. & Snyder M. W. Genomic Medicine-Progress, Pitfalls, and Promise. Cell 177, 45–57 (2019). - PMC - PubMed
    1. Claussnitzer M. et al. A brief history of human disease genetics. Nature 577, 179–189 (2020). - PMC - PubMed
    1. Abdellaoui A., Yengo L., Verweij K. J. H. & Visscher P. M. 15 years of GWAS discovery: Realizing the promise. Am. J. Hum. Genet. 110, 179–194 (2023). - PMC - PubMed
    1. Sollis E. et al. The NHGRI-EBI GWAS Catalog: knowledgebase and deposition resource. Nucleic Acids Res. 51, D977–D985 (2023). - PMC - PubMed

Publication types