[Preprint]. 2025 May 8:2024.12.10.24318805.
doi: 10.1101/2024.12.10.24318805.

Heterogeneity in and correlation between host transmissibility and susceptibility can greatly impact epidemic dynamics

Affiliations

Heterogeneity in and correlation between host transmissibility and susceptibility can greatly impact epidemic dynamics

Beth M Tuschhoff et al. medRxiv. .

Update in

Abstract

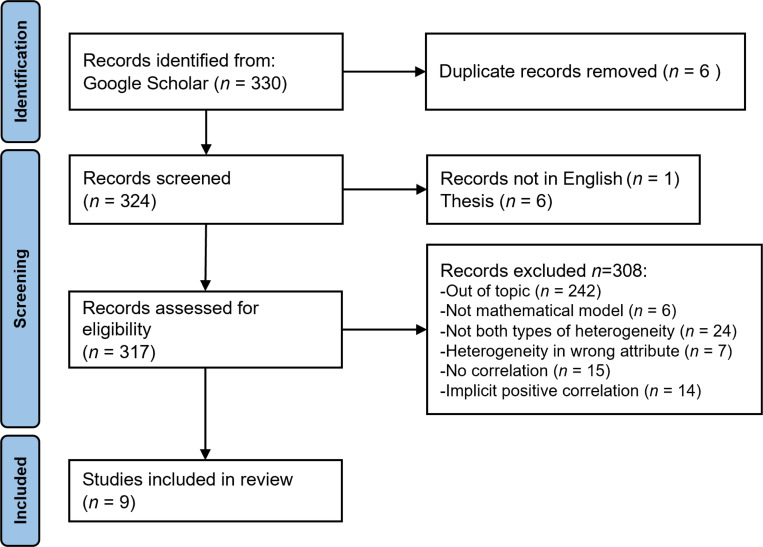
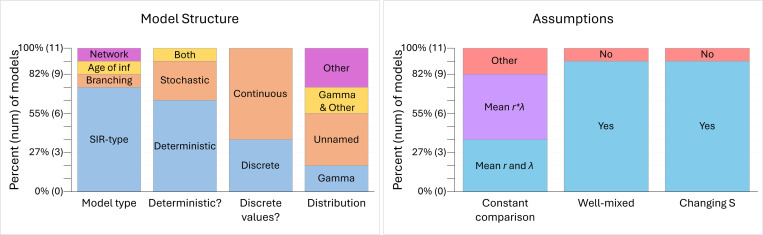
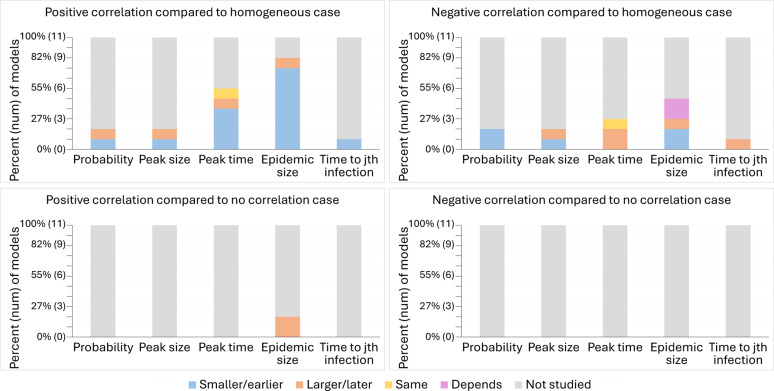
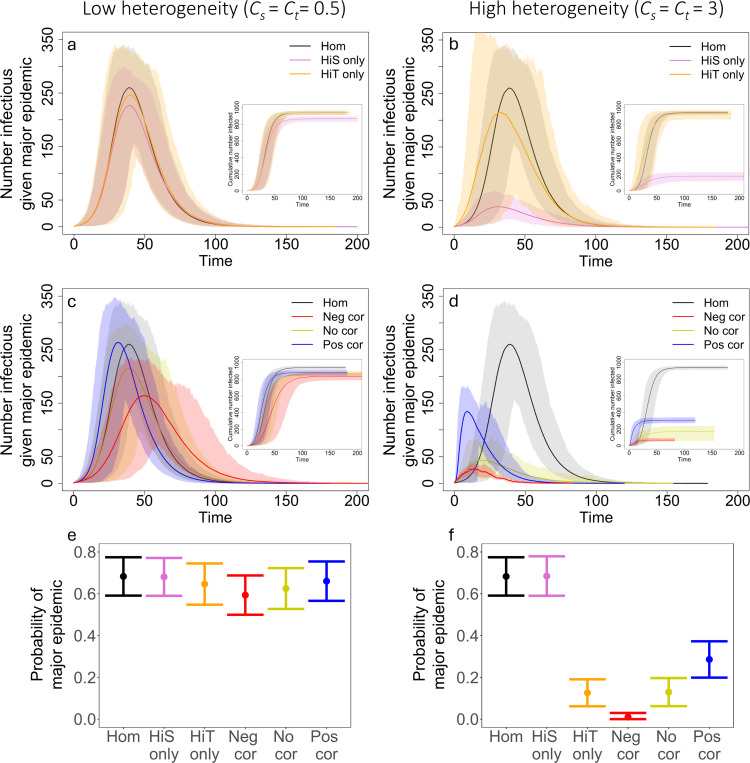
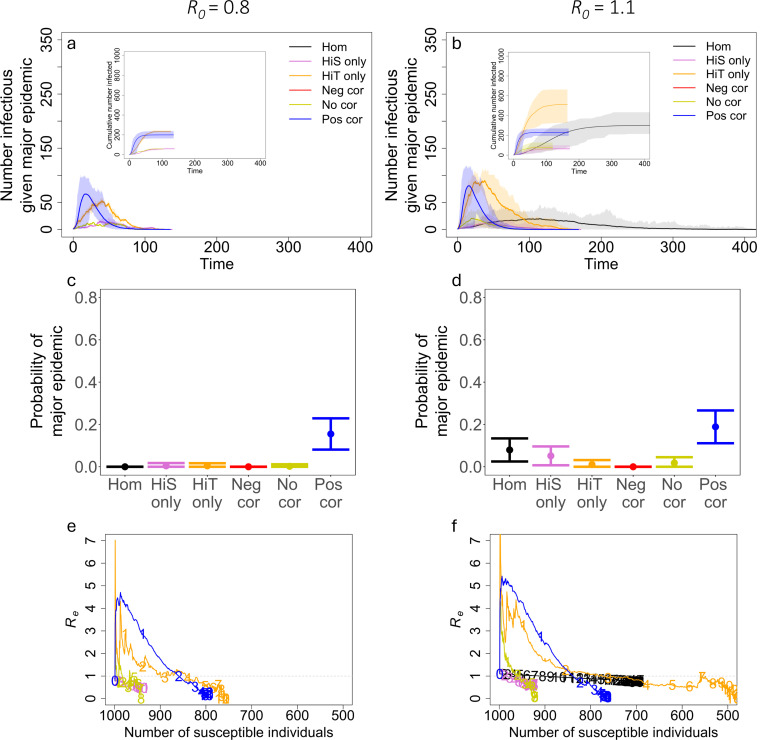
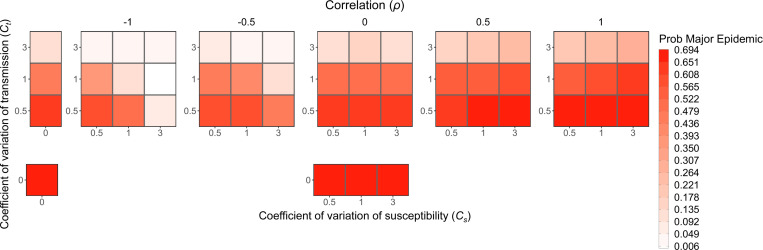
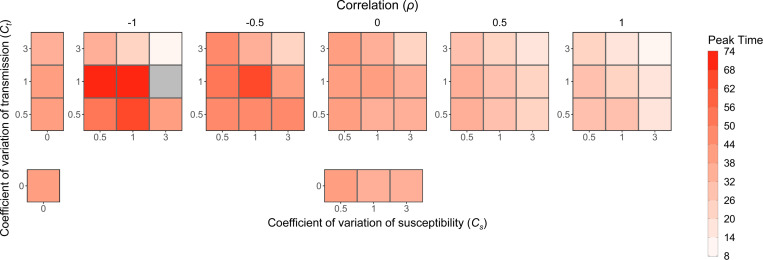
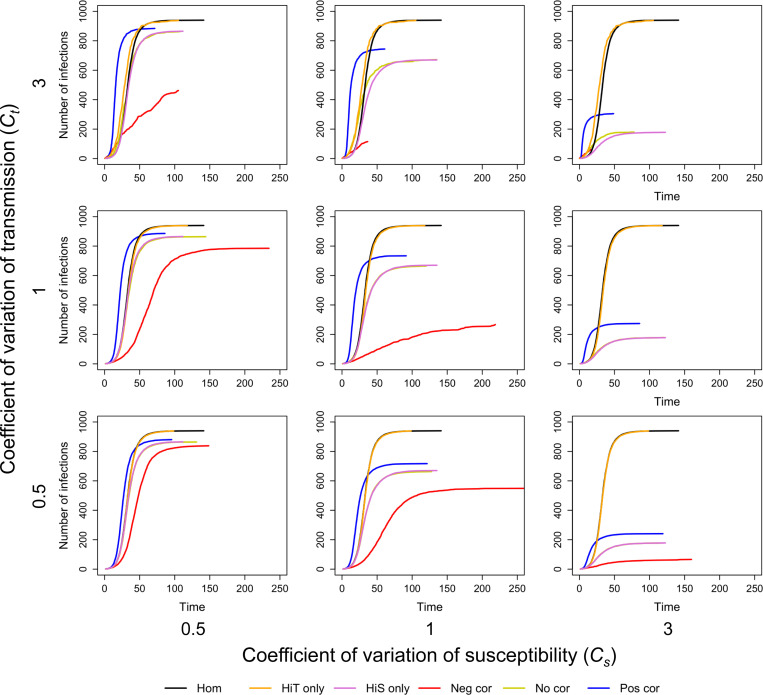
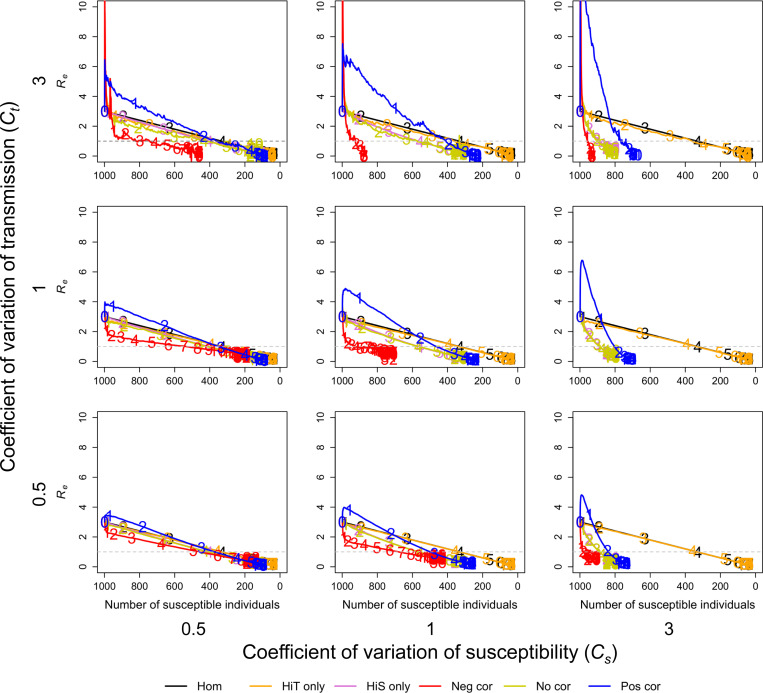
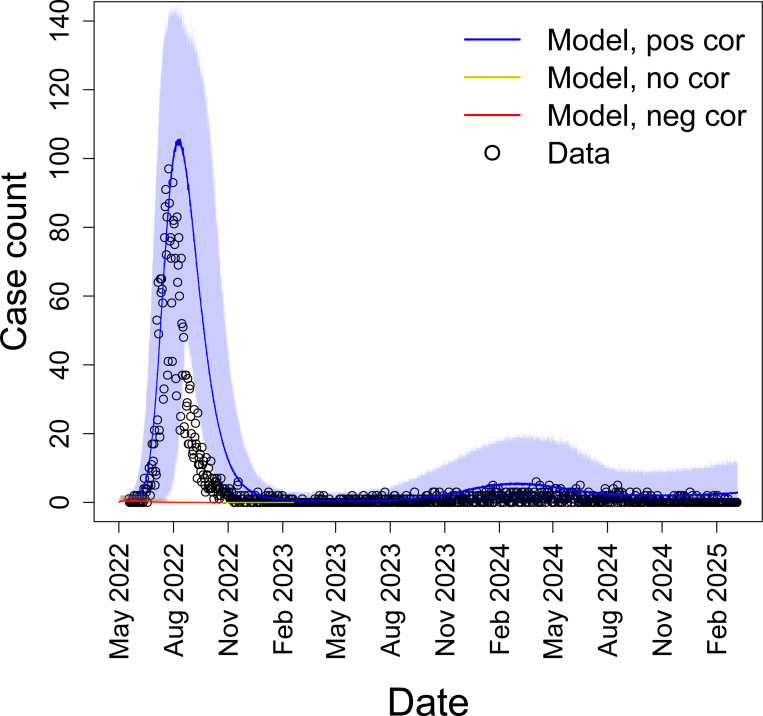
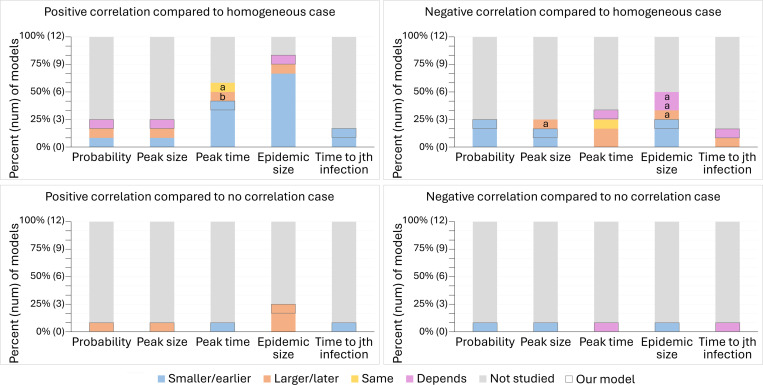
While it is well established that host heterogeneity in transmission and host heterogeneity in susceptibility each individually impact disease dynamics in characteristic ways, it is generally unknown how disease dynamics are impacted when both types of heterogeneity are simultaneously present. Here we explore this question. We first conducted a systematic review of published studies from which we determined that the effects of correlations have been drastically understudied. We then filled in the knowledge gaps by developing and analyzing a stochastic, individual-based SIR model that includes both heterogeneity in transmission and susceptibility and flexibly allows for positive or negative correlations between transmissibility and susceptibility. We found that in comparison to the uncorrelated case, positive correlations result in major epidemics that are larger, faster, and more likely, whereas negative correlations result in major epidemics that are smaller and less likely. We additionally found that, counter to the conventional wisdom that heterogeneity in susceptibility always reduces outbreak size, heterogeneity in susceptibility can lead to major epidemics that are larger and more likely than the homogeneous case when correlations between transmissibility and susceptibility are positive, but this effect only arises at small to moderate R 0 . Moreover, positive correlations can frequently lead to major epidemics even with subcritical R 0 . To illustrate the potential importance of heterogeneity and correlations, we developed an SEIR model to describe mpox disease dynamics in New York City, demonstrating that the dynamics of a 2022 outbreak can be reasonably well explained by the presence of positive correlations between susceptibility and transmissibility. Ultimately, we show that correlations between transmissibility and susceptibility profoundly impact disease dynamics.

Keywords: correlation; heterogeneity in susceptibility; heterogeneity in transmission; infectious disease dynamics; mpox.


Figures

Figure 1:
Figure 1:
PRISMA systematic review framework.
Figure 2:
Figure 2:
Models were built using various model structures and assumptions. These plots show the number of models that were built under each structure and assumption. For model structure, the model type is either an SIR-type (SIR, SI, etc.), a branching process, an age of infection model, or a directed network. Models were set up as deterministic, stochastic, or both to explore different results. The distributions used to model the values for susceptibility and transmissibility were either discrete or continuous and the type of distribution explored in each study was a gamma distribution, an unnamed distribution where authors set their own values, a gamma distribution plus another distribution, or solely another type of distribution like a lognormal or uniform distribution. For assumptions, models compare the effects of correlation to the uncorrelated and homogeneous cases by keeping the mean susceptibility and mean transmissibility constant (i.e., R0 defined as in Eq 6; “Mean r and λ”), keeping the mean product of susceptibility and transmissibility constant (i.e., R0 defined as in Eq 7; “Mean rλ ”), or by keeping the growth rate for the first month of the epidemic or the median product of susceptibility and transmissibility constant (“Other”). Most models assume a well-mixed population and a changing susceptible population size over time.
Figure 3:
Figure 3:
Authors of the selected studies in our systematic review tend to be associated with quantitative fields, especially physics, math, and biophysics. This plot shows the number of authors affiliated with each of the different fields of study represented in the selected studies. Authors’ affiliations were identified by their department or research group and focus at the time the study was published. While there are 31 authors across the studies, some authors are represented multiple times as they are affiliated with multiple fields.
Figure 4:
Figure 4:
Models tend to disagree about the effects of correlation, and many epidemic measures are understudied, especially comparisons to the no correlation case. These plots show the effects of positive and negative correlations between heterogeneity in transmission and susceptibility on the probability of a major epidemic, peak size, peak time, final epidemic size, and time to the jth infection in comparison to disease dynamics with homogeneity or no correlation according to 11 models from the 9 studies included in the systematic review. The effect of correlation is classified for each model and measure as resulting in an attribute that is smaller/earlier (blue), larger/later (orange), the same (yellow), dependent on the levels of heterogeneity (purple), or not studied (gray) in comparison to the homogeneous or no correlation case.
Figure 5:
Figure 5:
Correlations affect the disease dynamics in our model. The plots (a-d) show the average number of infected individuals over the course of an epidemic. Shaded regions represent 95% CIs determined from the major epidemics of 500 simulations for homogeneity (black), heterogeneity in susceptibility only (pink), heterogeneity in transmission only (orange), negative correlation (red, ρ=1), no correlation (yellow, ρ=0), and positive correlation (blue, ρ=1). (e,f) The average probability of a major epidemic for each case with 500 simulations and error bars of +/− 2 standard deviations. (Insets) The cumulative number of individuals infected with 95% CIs from the major epidemics of 500 simulations. Cs=Ct=0.5 in (a,c,e), Cs=Ct=3 in (b,d,f), N=1000, I0=1, and R0=3.
Figure 6:
Figure 6:
Positive correlations can lead to larger, more likely major epidemics when R0 is small. (a,b) The average number of infected individuals over the course of an epidemic. Shaded regions represent 95% CIs determined from the major epidemics of 500 simulations for homogeneity (black), heterogeneity in susceptibility only (pink), heterogeneity in transmission only (orange), negative correlation (red, ρ=1), no correlation (yellow, ρ=0), and positive correlation (blue, ρ=1). (c,d) The average probability of a major epidemic for each case with 500 simulations and error bars of 2xSD. (e,f) Re plotted against the number of susceptible individuals (S) averaged over the major epidemics from 500 simulations. The numbers on each trajectory represent time in the epidemic for every 10 units of time starting from the left (e.g., 1 is placed at time t=10, 2 at t=20, etc.). The dotted gray line shows Re=1. (Insets) The cumulative number of individuals infected with 95% CIs from the major epidemics of 500 simulations. Cs=Ct=3, R0=0.8 in (a,c,e), R0=1.1 in (b,d,f), N=1000, and I0=1.
Figure 7:
Figure 7:
The probability of a major epidemic decreases as the level of heterogeneity in transmission increases, increases with positive correlation, and decreases with negative correlation. Each box is shaded to show the probability of a major epidemic, as defined in the text, averaged over the major epidemics from 500 simulations for various levels of heterogeneity in transmission (Ct), heterogeneity in susceptibility (Cs), and the correlation between transmissibility and susceptibility. While heterogeneity in transmission primarily determines the probability of a major epidemic, there are also effects from correlation and heterogeneity in susceptibility. Positive correlation results in a higher probability, negative correlation results in a lower probability, and increased levels of heterogeneity in susceptibility further decrease the chance of a major epidemic when there is a negative correlation. N=1000, I0=1, and R0=3.
Figure 8:
Figure 8:
Peak time is earlier with positive correlation and later with negative correlation. Each box is shaded to show the peak time averaged over the major epidemics from 500 simulations for various levels of heterogeneity in transmission (Ct), heterogeneity in susceptibility (Cs), and the correlation between transmissibility and susceptibility. The number of simulations that were major epidemics, which can be determined by the probability of a major epidemic in Fig 7, was different for each parameter combination, so the average in each box is based on a different sample size. The gray box represents a parameter combination that resulted in no major epidemics as defined in the text. N=1000, I0=1 and R0=3.
Figure 9:
Figure 9:
Time to the jth infection is earlier with positive correlation and later with negative correlation. The plots show the median time to the jth infection (where j is the value on the y-axis) from the major epidemics from 500 simulations for various levels of heterogeneity in transmission (Ct), heterogeneity in susceptibility (Cs), and the correlation between transmissibility and susceptibility. Each plot includes trajectories for the cases of homogeneity (black), heterogeneity in transmission alone (orange), heterogeneity in susceptibility alone (purple), perfect negative correlation (ρ=1, red), no correlation (yellow), and perfect positive correlation (ρ=1, blue). The number of simulations that were major epidemics, which can be determined by the probability of a major epidemic in Fig 7, was different for each parameter combination, so each line is based on a different sample size. There is no line for negative correlation with Ct=1 and Cs=3 because this parameter combination resulted in no major epidemics as defined in the text. N=1000, I0=1, and R0=3.
Figure 10:
Figure 10:
The effective reproductive number Re depends on both the levels of heterogeneity and the correlation. The plots show Re plotted against the number of susceptible individuals (S) averaged over the major epidemics from 500 simulations for various levels of heterogeneity in transmission (Ct), heterogeneity in susceptibility (Cs), and the correlation between transmissibility and susceptibility. Each plot includes trajectories for the cases of homogeneity (black), heterogeneity in transmission alone (orange), heterogeneity in susceptibility alone (purple), perfect negative correlation (red, ρ=1), no correlation (yellow, ρ=0), and perfect positive correlation (blue, ρ=1). The numbers on each trajectory represent time in the epidemic for every 10 units of time starting from the left (e.g., 1 is placed at time t=10, 2 at t=20, etc.). The dotted gray lines show Re=1. The number of simulations that were major epidemics, which can be determined by the probability of a major epidemic in Fig 7, was different for each parameter combination, so each line is based on a different sample size. There is no line for negative correlation with Ct=1 and Cs=3 because this parameter combination resulted in no major epidemics as defined in the text. N=1000, I0=1, and R0=3.
Figure 11:
Figure 11:
Mpox dynamics in New York City are generally consistent with positive correlations between transmissibility and susceptibility. Daily case counts of mpox in New York City (black circles) from May 19, 2022 to March 8, 2025 and the average number of infectious individuals from our SEIR model starting May 2, 2022 for positive correlation (blue, ρ=1), no correlation (yellow, ρ=0), and negative correlation (red, ρ=1). Shaded regions represent the 95% CIs of 500 simulations. Note that there was a slightly faster than expected decline in cases compared to our positive correlation model in the latter half of the 2022 epidemic, which may be attributable to vaccination and other public health measures. Cs=Ct=3, R0=0.52 (Eq 6), N=70180, and E0=19.
Figure 12:
Figure 12:
Results from our model fill in knowledge gaps about the effects of correlation from the systematic review. These plots show the effects of positive and negative correlations between transmissibility and susceptibility on the probability of a major epidemic, peak size, peak time, final epidemic size, and time to the jth infection in comparison to disease dynamics with homogeneity or no correlation according to 11 models from the 9 studies included in the systematic review and our model. The effect of correlation is classified for each model and measure as resulting in an attribute that is smaller/earlier (blue), larger/later (orange), the same (yellow), any of these results depending on the levels of heterogeneity or value of R0 (purple), or not studied (gray) in comparison to the homogeneous or no correlation case. The results from our model have a black outline. For positive correlation compared to the homogeneous case, we found that the effect of correlation on the probability of a major epidemic and the final epidemic size depends on R0 (defined by Eq 6), and the effect of correlation on the peak size depends on R0 and the level of heterogeneity. When R0 is close to or less than 1 (R0=0.8 or 1.1), positive correlation results in a larger probability, peak, and final epidemic size than with homogeneity, whereas when R0 is increased (R0=3), positive correlations results in a less likely and smaller epidemic than with homogeneity. With R0=3, the peak size can still be larger for positive correlations than homogeneity when there is high heterogeneity in transmission and low heterogeneity in susceptibility. Also, note that the time to the jth infection is earlier for positive correlations than homogeneity under the condition that j is not large (i.e., j is not close to the final epidemic size). For negative correlation, we found that the effect of correlation on both the peak time and the time to the jth infection depends on the level of heterogeneity in transmission. High heterogeneity leads to an earlier peak and jth infection compared to the homogeneous and no correlation cases while low heterogeneity leads to these attributes being later. The letters ‘a’ and ‘b’ denote results from the systematic review models that are inconsistent with our results where ‘a’ means the model associated with that result defined R0 according to Eq 7 and ‘b’ means the model kept a constant growth rate for the first month.

Similar articles

References

    1. Aguas R., Corder R.M., King J.G., Goncalves G., Ferreira M.U., Gomes M.G.M., 2020. Herd immunity thresholds for SARS-CoV-2 estimated from unfolding epidemics. medRxiv.
    1. Allard A., Moore C., Scarpino S.V., Althouse B.M., Hébert-Dufresne L., 2023. The role of directionality, heterogeneity, and correlations in epidemic risk and spread. SIAM Review 65, 471–492.
    1. Anderson R.M., May R.M., 1991. Infectious diseases of humans: dynamics and control. Cambridge University Press.
    1. Anderson T.L., Nande A., Merenstein C., Raynor B., Oommen A., Kelly B.J., Levy M.Z., Hill A.L., 2023. Quantifying individual-level heterogeneity in infectiousness and susceptibility through household studies. Epidemics 44. 100710. - PMC - PubMed
    1. Andreasen V., 2011. The final size of an epidemic and its relation to the basic reproduction number. Bulletin of Mathematical Biology 73, 2305–2321. - PMC - PubMed

Publication types

LinkOut - more resources