

This is a preprint.
Evaluation of DBS computational modeling methodologies using in-vivo electrophysiology in Parkinson's disease
- PMID: 40385436
- PMCID: PMC12083610
- DOI: 10.1101/2025.05.05.25326314
Evaluation of DBS computational modeling methodologies using in-vivo electrophysiology in Parkinson's disease
Abstract
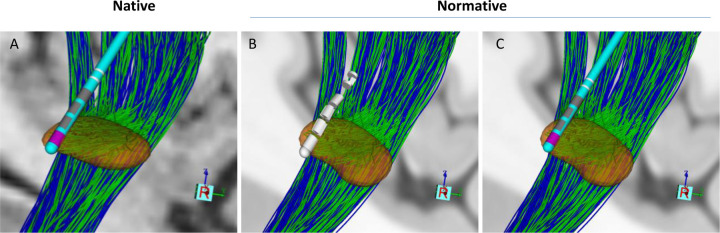
Deep brain stimulation (DBS) is an effective therapy for Parkinson's disease (PD) and other neuropsychiatric disorders, but its outcomes vary due to differences in patient selection, electrode placement, and programming. Optimizing DBS parameter settings requires postoperative adjustments through a trial-and-error process, which is complex and time-consuming. As such, researchers have been developing patient-specific computational models to help guide DBS programming. Despite growing interest in image-guided DBS technology, and recent adoption into clinical practice, the direct validation of the prediction accuracy remains limited. The objective of this study was to establish a comparative framework for validating the accuracy of various DBS computational modeling methodologies in predicting the activation of clinically relevant pathways using in vivo measurements from PD patients undergoing subthalamic (STN) DBS surgery. Our prior work assessed the accuracy of driving force (DF) models in native space by predicting activation of the corticospinal/bulbar tract (CSBT) and cortico-subthalamic hyperdirect pathway (HDP) using very short- (<2 ms) and short-latency (2-4 ms) cortical evoked potentials (cEPs). In this study, we extended our previous work by comparing the accuracy of five computational modeling variations for predicting the activation of HDP and CSBT based on three key factors: modeling method (DF vs. Volume of Tissue Activated [VTA]), imaging space (native vs. normative), and anatomical representation (pathway vs. volume). The model performances were quantified using the coefficient of determination (R2) between the cEP amplitudes and percent pathway activation or percent volume (structure) overlap. We compared model accuracy for 11 PD patients. The DF-Native-Pathway model was the most accurate method for quantitatively predicting experimental subcortical pathway activations. Additionally, our analysis showed that using normative brain space, instead of native (i.e., patient-specific) space, significantly diminished the accuracy of model predictions. Although the DF and VTA modeling methods exhibited comparable accuracy for the hyperdirect pathway, they diverged significantly in their predictions for the corticospinal tract. In conclusion, we believe that the choice of methodology should depend on the specific application and the required level of precision in clinical, surgical, or research settings. These findings offer valuable guidance for developing more accurate models, facilitating reliable DBS outcome predictions, and advancing both clinical practice and research.
Conflict of interest statement
Competing Interests C.C.M. is a paid consultant for Boston Scientific Neuromodulation, receives royalties from Hologram Consultants, Neuros Medical, Ceraxis, Qr8 Health, and is a shareholder in the following companies: Hologram Consultants, Surgical Information Sciences, BrainDynamics, CereGate, Cardionomic, and Enspire DBS.
Figures


Similar articles
-
Model-based deconstruction of cortical evoked potentials generated by subthalamic nucleus deep brain stimulation.J Neurophysiol. 2018 Aug 1;120(2):662-680. doi: 10.1152/jn.00862.2017. Epub 2018 Apr 25. J Neurophysiol. 2018. PMID: 29694280 Free PMC article.
-
Neural pathway activation in the subthalamic region depends on stimulation polarity.Brain Commun. 2025 Jan 21;7(1):fcaf006. doi: 10.1093/braincomms/fcaf006. eCollection 2025. Brain Commun. 2025. PMID: 39980742 Free PMC article.
-
Neural pathway activation in the subthalamic region depends on stimulation polarity.medRxiv [Preprint]. 2024 May 2:2024.05.01.24306044. doi: 10.1101/2024.05.01.24306044. medRxiv. 2024. Update in: Brain Commun. 2025 Jan 21;7(1):fcaf006. doi: 10.1093/braincomms/fcaf006. PMID: 38746250 Free PMC article. Updated. Preprint.
-
Electrophysiological characterization of the hyperdirect pathway and its functional relevance for subthalamic deep brain stimulation.Exp Neurol. 2022 Jun;352:114031. doi: 10.1016/j.expneurol.2022.114031. Epub 2022 Mar 2. Exp Neurol. 2022. PMID: 35247373 Review.
-
Evolving characterization of the human hyperdirect pathway.Brain Struct Funct. 2023 Mar;228(2):353-365. doi: 10.1007/s00429-023-02610-5. Epub 2023 Jan 28. Brain Struct Funct. 2023. PMID: 36708394 Free PMC article. Review.
References
-
- Akram H., Georgiev D., Mahlknecht P., Hyam J., Foltynie T., Limousin P., Jahanshahi M., Hariz M., Zrinzo L., Ashburner J., Behrens T., Sotiropoulos S. N., Jbabdi S., & De Vita E. (2017). Subthalamic deep brain stimulation sweet spots and hyperdirect cortical connectivity in Parkinson’s disease. NeuroImage, 158, 332–345. 10.1016/J.NEUROIMAGE.2017.07.012 - DOI - PMC - PubMed
-
- Andersson J. L. R., Jenkinson M., & Smith S. (2007). Non-linear registration aka Spatial normalisation FMRIB Technial Report TR07JA2.
Publication types
Grants and funding
LinkOut - more resources
Full Text Sources
Research Materials
Miscellaneous