[Preprint]. 2025 May 7:2025.05.05.25326880.
doi: 10.1101/2025.05.05.25326880.

Unravelling the molecular mechanisms causal to type 2 diabetes across global populations and disease-relevant tissues

Affiliations

Unravelling the molecular mechanisms causal to type 2 diabetes across global populations and disease-relevant tissues

Ozvan Bocher et al. medRxiv. .

Abstract

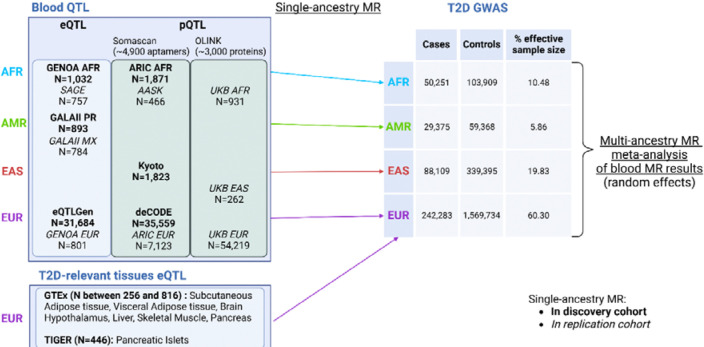
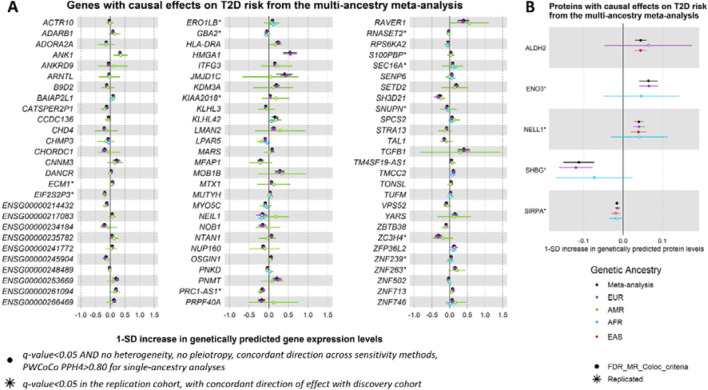
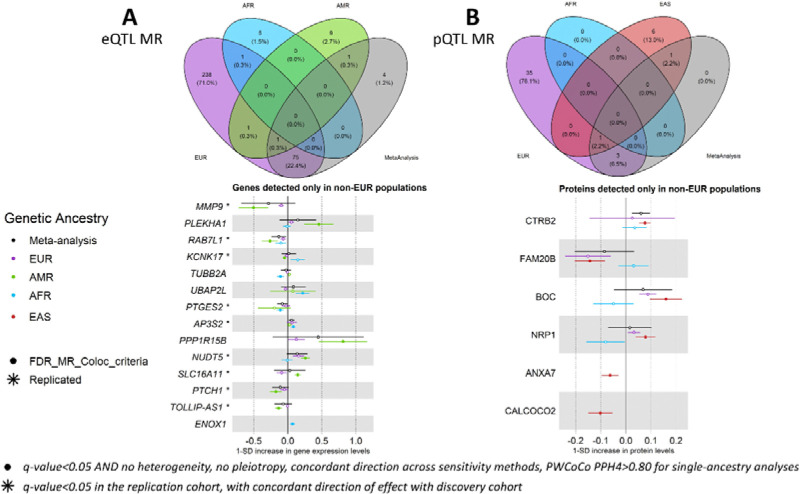
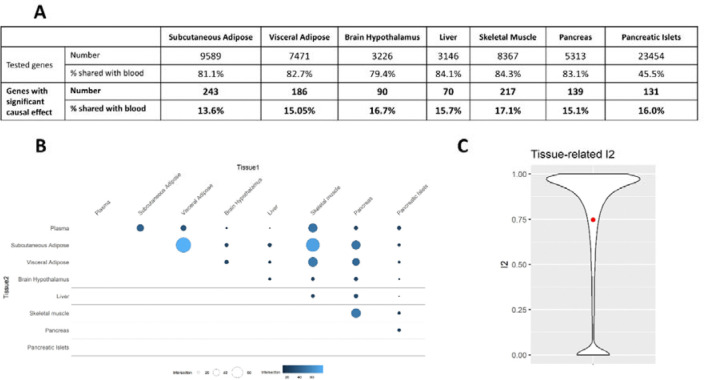
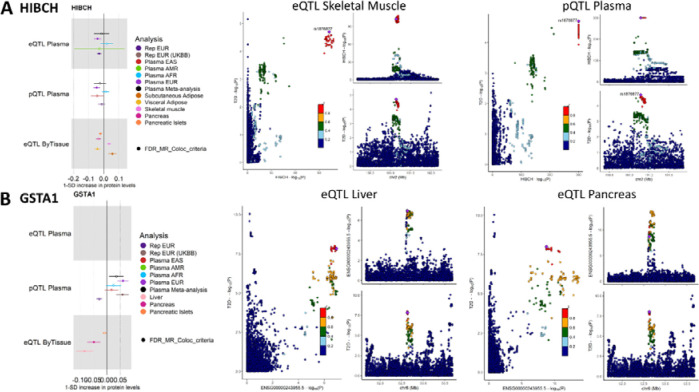
Type 2 diabetes (T2D) is a prevalent disease that arises from complex molecular mechanisms. Here, we leverage T2D multi-ancestry genetic associations to identify causal molecular mechanisms in an ancestry- and tissue-aware manner. Using two-sample Mendelian Randomization corroborated by colocalization across four global ancestries, we analyze 20,307 gene and 1,630 protein expression levels using blood-derived cis-quantitative trait loci (QTLs). We detect causal effects of genetically predicted levels of 335 genes and 46 proteins on T2D risk, with 16.4% and 50% replication in independent cohorts, respectively. Using gene expression cis-QTLs derived from seven T2D-relevant tissues, we identify causal links between the expression of 676 genes and T2D risk, including novel associations such as CPXM1, PTGES2 and FAM20B. Causal effects are mostly shared across ancestries, but highly heterogeneous across tissues. Our findings provide insights in cross-ancestry and tissue-informed multi-omics causal inference analysis approaches and demonstrate their power in uncovering molecular processes driving T2D.


Conflict of interest statement

Conflict of interest The authors declare no conflict of interest.

Figures

Figure 1:
Figure 1:
Overview of the cohorts and tissues used to perform single-ancestry MR analyses in populations genetically similar to Europeans (EUR), Africans (AFR), admixed Americans (AMR), and East-Asians (EAS) based on the 1000 Genome Project phase 3. Discovery cohorts are indicated in bold, and replication cohorts for blood MR analyses in italic. Figure generated with Biorender.
Figure 2:
Figure 2:
Genes and proteins with causal effects identified in the MR multi-ancestry meta-analysis. Causal estimates from the single-ancestry MR in the discovery cohorts are also depicted. Filled dots represent causal estimates from MR analyses that have a q-value<0.05, and (1) pass the sensitivity criteria and show evidence of colocalization (PPH4>0.8) in single-ancestry analyses, or (2) present nominal significance and meet criteria (1) in at least one cohort entering the meta-analysis. Genes and proteins with causal effects identified in single-ancestry analyses and replicated in independent cohorts from the same genetic ancestry group are denoted with a star. We report causal estimates as odds ratios (OR) for T2D per standard deviation (SD) change in genetically predicted gene expression or protein levels.
Figure 3:
Figure 3:
Venn-diagrams showing the overlap of putative causal effects between genetic ancestry groups and forest plots of causal effects of genes (A) and proteins (B) detected only in non-EUR. Filled dots represent causal estimates from MR analyses that have a q-value<0.05, and (1) pass the sensitivity criteria and show evidence of colocalization (PPH4>0.8) in single-ancestry analyses, or (2) present nominal significance and meet criteria (1) in at least one cohort entering the meta-analysis. Genes and proteins with causal effects identified in single-ancestry analyses and replicated in independent cohorts from the same genetic ancestry group are denoted with a star. We report causal estimates as odds ratios (OR) for T2D per standard deviation (SD) change in genetically predicted gene expression or protein levels.
Figure 4:
Figure 4:
Distribution of differences between EUR and non-EUR in minor allele frequencies (MAF) of IVs for genes and proteins only tested in non-EUR. The differences were computed as MAFEUR – MAFnon–EUR. MAF were obtained from the Genome Aggregation Database (gnomAD). gnomADg_NFE_MAF refers to the MAF observed in gnomAD genomes in the Non-Finnish European (NFE) population. Positive differences, i.e. IVs for which the MAF is higher in NFE than in the corresponding non-EUR ancestry group, are represented in red, and negative differences in grey.
Figure 5:
Figure 5:
Overview of the results from the MR analyses in T2D-relevant tissues. (A) Number of genes tested in MR analyses from T2D-relevant tissues, with significant causal effects on T2D risk, and percentage of causal effects also detected in blood eQTL MR. (B) Pairwise overlap of significant causal effects across T2D-relevant tissues and blood eQTL MR. (C) Distribution of I2 values representing the heterogeneity of causal estimates for genes tested in at least two tissues (including blood).
Figure 6:
Figure 6:
Results for HIBCH (A) and GSTA1 (B). For each molecular trait, the causal estimates from the blood eQTL, plasma pQTL, and T2D-relevant tissues eQTL MR analyses are represented, as well as the LocusCompare and LocusZoom plots demonstrating the colocalization evidence from eQTL in T2D-relevant tissues. We report causal estimates as odds ratios (OR) for T2D per standard deviation (SD) change in genetically predicted gene expression or protein levels.

Similar articles

References

    1. Mahajan A. et al. Multi-ancestry genetic study of type 2 diabetes highlights the power of diverse populations for discovery and translation. Nat Genet 54, 560–572 (2022). 10.1038/s41588-022-01058-3 - DOI - PMC - PubMed
    1. Suzuki K. et al. Genetic drivers of heterogeneity in type 2 diabetes pathophysiology. Nature (2024). 10.1038/s41586-024-07019-6 - DOI - PMC - PubMed
    1. Pearson E. R. Type 2 diabetes: a multifaceted disease. Diabetologia 62, 1107–1112 (2019). 10.1007/s00125-019-4909-y - DOI - PMC - PubMed
    1. Zhao H. et al. Proteome-wide Mendelian randomization in global biobank meta-analysis reveals multi-ancestry drug targets for common diseases. Cell Genom 2, None (2022). 10.1016/j.xgen.2022.100195 - DOI - PMC - PubMed
    1. Davey Smith G. & Hemani G. Mendelian randomization: genetic anchors for causal inference in epidemiological studies. Hum Mol Genet 23, R89–98 (2014). 10.1093/hmg/ddu328 - DOI - PMC - PubMed

Publication types

LinkOut - more resources