[Preprint]. 2025 May 7:2025.05.06.25326635.
doi: 10.1101/2025.05.06.25326635.

Androgens mediate sexual dimorphism in Pilarowski-Bjornsson Syndrome

Kimberley Jade Anderson  1 Eirny Tholl Thorolfsdottir  1 Ilana M Nodelman  2 Sara Tholl Halldorsdottir  3 Stefania Benonisdottir  4   5 Malak Alghamdi  6 Naif Almontashiri  7   8 Brenda J Barry  9   10   11 Matthias Begemann  12 Jacquelyn F Britton  13 Sarah Burke  14 Benjamin Cogne  15   16 Ana S A Cohen  17   18 Carles de Diego Boguñá  19 Evan E Eichler  20   21 Elizabeth C Engle  9   10   11   22   23   24   25 Jill A Fahrner  13   26 Laurence Faivre  27   28 Mélanie Fradin  29 Nico Fuhrmann  30 Christine W Gao  13   31 Gunjan Garg  32   33   34 Dagmar Grečmalová  35 Mina Grippa  36 Jacqueline R Harris  13   37 Kendra Hoekzema  21 Tova Hershkovitz  38 Sydney Hubbard  14 Katrien Janssens  39 Julie A Jurgens  9   10   22   23 Stanislav Kmoch  40 Cordula Knopp  12 Meral Aktas Koptagel  12 Farah A Ladha  41 Pablo Lapunzina  42 Tobias Lindau  43 Marije Meuwissen  39 Andreina Minicucci  44 Emily Neuhaus  45 Mathilde Nizon  46 Lenka Nosková  40 Kristen Park  47 Chirag Patel  48 Rolph Pfundt  49 Pankaj Prasun  50 Nils Rahner  51 Nathaniel H Robin  52 Carey Ronspies  53 Jasmin Roohi  54 Jill Rosenfeld  55   41 Margarita Saenz  47 Carol Saunders  17   18 Zornitza Stark  56 Isabelle Thiffault  17   18 Sarah Thull  30 Danita Velasco  53 Clara Velmans  30 Jolijn Verseput  57 Antonio Vitobello  27 Tianyun Wang  58   59   60 Karin Weiss  61 Ingrid M Wentzensen  62 Genay Pilarowski  63 Thor Eysteinsson  64   65 Madelyn Gillentine  66 Kári Stefánsson  67   68 Agnar Helgason  67   69 Gregory D Bowman  2 Hans Tomas Bjornsson  1   3   13   26
Affiliations

Androgens mediate sexual dimorphism in Pilarowski-Bjornsson Syndrome

Kimberley Jade Anderson et al. medRxiv. .

Abstract

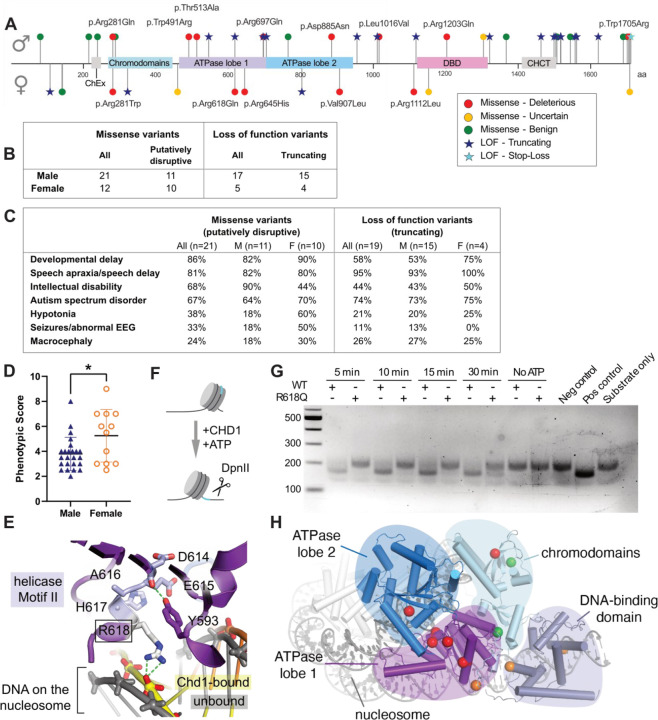
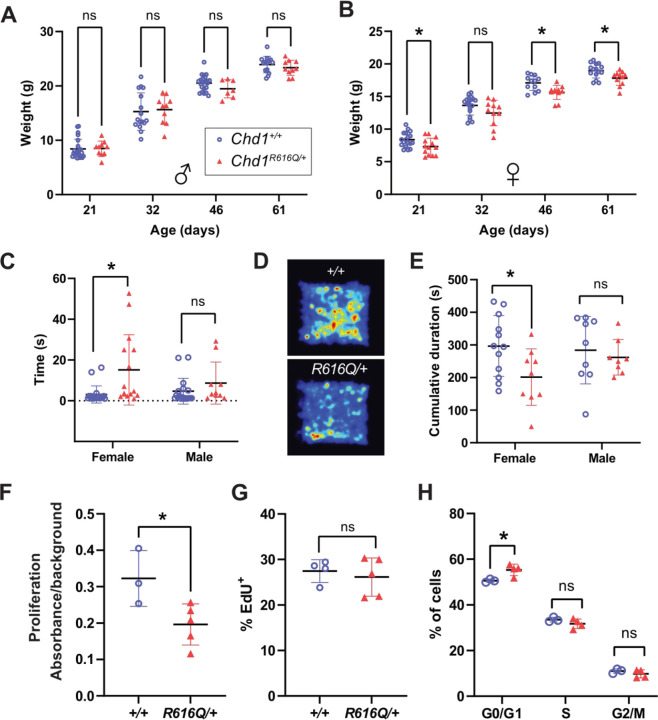
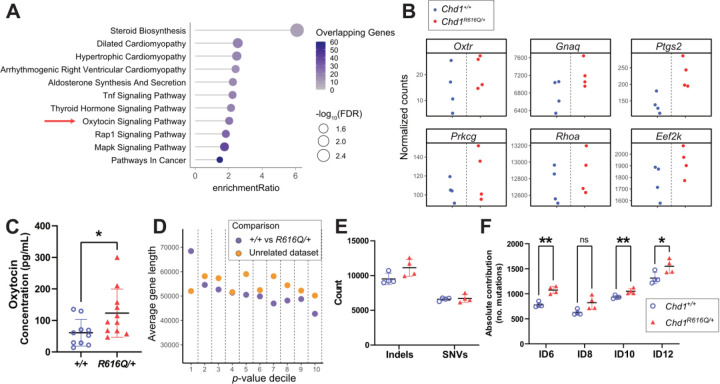
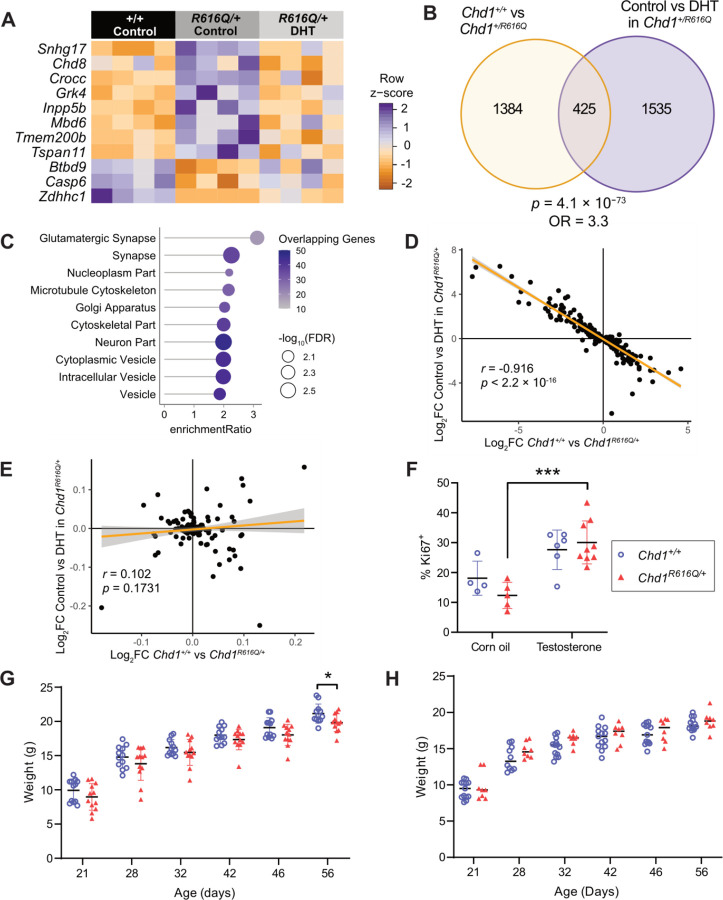
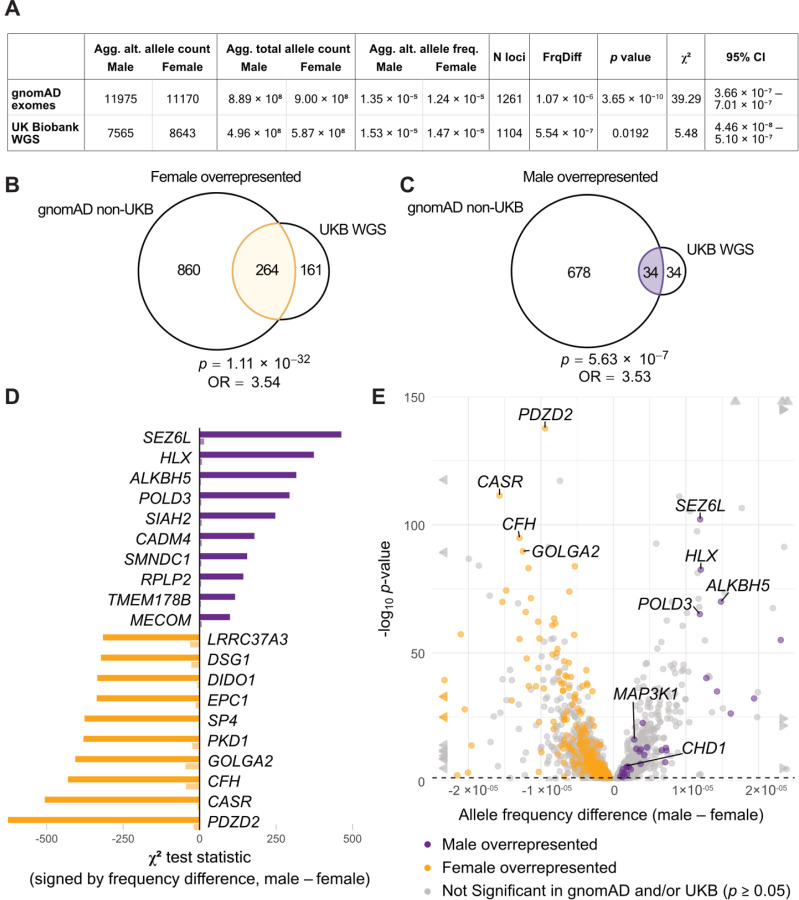
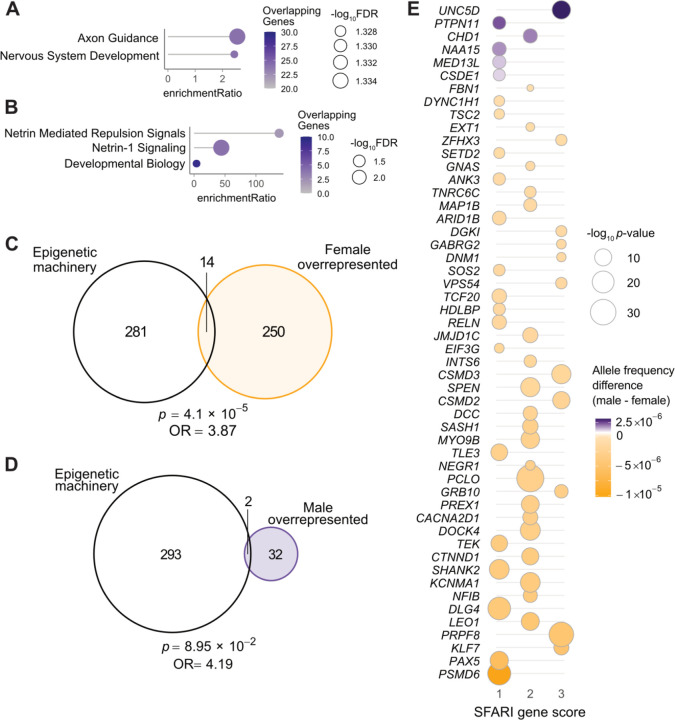
Sex-specific penetrance in autosomal dominant Mendelian conditions is largely understudied. The neurodevelopmental disorder Pilarowski-Bjornsson syndrome (PILBOS) was initially described in females. Here, we describe the clinical and genetic characteristics of the largest PILBOS cohort to date, showing that both sexes can exhibit PILBOS features, although males are overrepresented. A mouse model carrying a human-derived Chd1 missense variant (Chd1 R616Q/+) displays female-restricted phenotypes, including growth deficiency, anxiety and hypotonia. Orchiectomy unmasks a growth deficiency phenotype in male Chd1 R616Q/+ mice, while testosterone rescues the phenotype in females, implicating androgens in phenotype modulation. In the gnomAD and UK Biobank databases, rare missense variants in CHD1 are overrepresented in males, supporting a male protective effect. We identify 33 additional highly constrained autosomal genes with missense variant overrepresentation in males. Our results support androgen-regulated sexual dimorphism in PILBOS and open novel avenues to understand the mechanistic basis of sexual dimorphism in other autosomal Mendelian disorders.

Keywords: CHD1; Mendelian disease; Neurodevelopmental disorder; Sex differences.


Conflict of interest statement

Competing interests Dr. Bjornsson is Founder of KALDUR therapeutics and a consultant for Mahzi therapeutics. S.B. is a part of a working group called Alzheimer diagnostics that has received a grant from the Icelandic Technology Development Fund. I.M.W. is an employee of and may own stock in GeneDx. E.E.E. is a scientific advisory board (SAB) member of Variant Bio, Inc. K.S. and A.H. are employees of deCODE genetics, a subsidiary of Amgen. The Department of Medical and Molecular Genetics at Baylor College of Medicine receives revenue from clinical genetic testing completed at Baylor Genetics Laboratories.

Figures

Figure 1:
Figure 1:. PILBOS missense variants lead to loss of function of CHD1
(A) A schematic representation of the CHD1 protein. Location of variants shown as stars (LOF variants) and circles (missense variants). Male variants are above and female variants below the baseline. Color coding of missense variants represents likelihood of the variant leading to loss of function according to AlphaMissense. ChEx: Chd1 Exit-side binding domain, DBD: DNA-binding domain, CHCT: CHD C-terminal domain. (B) The distribution of missense and LOF variants in both sexes. (C) Key phenotypic aspects of individuals carrying missense variants predicted to cause loss of protein function and individuals carrying loss of function variants. (D) Phenotypic scores for females and males with curated missense and LOF variants (male, n = 24, female, n = 12). (E) Expected interactions for human CHD1 R618, based on a yeast Chd1-nucleosome structure, which would be potentially disrupted by the missense variant p.R618Q. (F) A schematic of the in vitro nucleosome remodeling assay. (G) A representative image from three biological replicates of the chromatin remodeling assay. The CHD1-WT and CHD1-R618Q proteins are denoted by “+” and “-” symbols. The upper band ~220bp represents the uncut nucleosome-wrapped DNA substrate. The lower band at ~180bp represents remodeled DpnII-digested DNA-nucleosome substrate. The negative control comprised the DNA alone, with no DpnII restriction site, and the positive control comprised DNA alone with the DpnII restriction site. DpnII was added to all conditions. (H) An overview of the CHD1 protein based on a yeast Chd1-nucleosome structure, with highlighted residues harboring missense variants. *p< 0.05, Welch’s two-tailed t-test, ns = not significant.
Figure 2:
Figure 2:. Chd1R616Q/+ mice exhibit female-limited growth, motor and behavioral phenotypes
(A) Weight of male Chd1R616Q/+ mice (n = 7–10) and WT littermates (n = 14–23). (B) Weight of female Chd1R616Q/+ mice (n = 11–13) and WT littermates (n = 12–18). (C) Righting reflex times in female (WT: n = 20, R616Q/+: n = 15) and male (WT: n = 18, R616Q/+: n = 10) Chd1R616Q/+ mice and WT littermates at postnatal day 6. (D) A representative heatmap depicting the arena area covered by female mice of both genotypes during a 10-minute open field test. (E) Cumulative duration of time spent in the center area of the open field for female (WT: n = 12, R616Q/+: n = 9) and male (WT: n = 9, R616Q/+: n = 8) Chd1R616Q/+ mice and WT littermates during a 10-minute test. (F) Proliferation of female NPCs in culture as measured by absorbance over background in a MTT assay (WT: n = 3, R616Q/+: n = 5). (G) Flow cytometry measurements of EdU incorporation into female NPC DNA over a 2h period in culture (WT: n = 3, R616Q/+: n = 5). (H) DNA content in female NPCs as measured by flow cytometry following DAPI staining of ethanol-permeabilized cells (WT: n = 3, R616Q/+: n = 4). *p< 0.05, ns: not significant.
Figure 3:
Figure 3:. Gene expression in Chd1R616Q/+ NPCs shows changes in oxytocin signaling, enrichment of long genes and a distinct mutational signature
(A) KEGG pathway gene ontology overrepresentation analysis for the comparison of gene expression results from Chd1+/+ vs Chd1R616Q/+. (B) Normalized RNAseq counts for genes involved in the oxytocin signaling pathway in Chd1+/+ and Chd1R616Q/+ NPCs, selected from the gene ontology overrepresentation analysis. (C) Oxytocin concentration in hypothalamic lysates from 3-month-old female Chd1R616Q/+ mice and WT littermates as measured by ELISA (WT: n = 10, R616Q/+: n = 11). (D) Average gene lengths for each p-value decile, with 1 being the most significant p-values for the WT vs Chd1R616Q/+ comparison and an unrelated wild-type NPC dataset. (E) Counts of indels and SNVs in RNAseq data. (F) Counts of mutations associated with COSMIC indel mutational signatures. *p< 0.05, **p < 0.01.
Figure 4:
Figure 4:. Androgens rescue Chd1R616Q/+ transcriptomic and in vivo phenotypes
(A) A heatmap depicting mRNA expression in NPCs, either WT or Chd1R616Q/+ treated with DMSO vehicle control, or Chd1R616Q/+ treated with 10nM DHT for 6h. (B) A Venn diagram displaying overlapping genes with the top 10% most significant p-values from the comparison between Chd1+/+ vs Chd1+/R616Q and DMSO vehicle control vs DHT in Chd1+/R616Q NPCs. The overlap was tested using Fisher’s exact test with a background of 19980 genes (number of protein coding genes in GENCODE hg38). (C) Overrepresentation analysis of overlapping gene list from B. (D) Plot of log2 fold changes for the genes with the 10% lowest p-values from the overlap in B. (E) Plot of log2 fold changes for the overlapping genes with the 10% highest p-values in the “WT vs Chd1R616Q/+” and “DMSO vs DHT in Chd1R616Q/+” comparisons. (F) Percent Ki-67+ cells in the telencephalon of embryonic day 18.5 embryos, as measured by antibody staining and flow cytometry (WT-corn oil: n = 4, R616Q/+-corn oil: n = 5, WT-testosterone: n = 6, R616Q/+- testosterone: n = 9). Embryos were obtained from 3–4 dams for each treatment. (G) Weight measurements over time in orchiectomized male Chd1R616Q/+ mice and WT littermates (n = 12 per genotype). (H) Weight measurements over time in female mice with a testosterone implant placed under skin at P15 (WT: n = 10–13, R616Q/+: n = 8). *p < 0.05, ***p < 0.001.
Figure 5:
Figure 5:. Sex-bias of rare missense variants in CHD1 and other highly constrained genes
(A) Comparison of aggregated alternate allele frequencies of rare (MAF < 1%) missense variants across males and females in the CHD1 gene in the total gnomAD exomes and UK Biobank WGS datasets. The two-proportions z-test was used to compare frequencies between sexes. The overlap between genes with nominal (B) female and (C) male overrepresentation (p < 0.05) of rare (MAF < 1%) missense variants for highly constrained (pLI > 0.9) autosomal genes in the gnomAD non-UKB exomes and UKB WGS datasets. The p values and odds ratios for the overlaps were calculated using Fisher’s exact test using a background of 19980 genes (number of protein coding genes in GENCODE hg38). (D) Chi-squared test statistic multiplied by the sign of the aggregated allele frequency differences for the top 10 genes from the overlapping gene lists. The sign corresponds to the direction of the aggregated allele frequency difference (male – female). (E) Sex differences in rare (MAF < 1%) missense variant frequencies for highly constrained (pLI > 0.9) autosomal genes. Each dot represents a gene, showing the aggregated alternate allele frequency difference (male – female) against the −log10 p-value from the gnomAD non-UKB exomes dataset. Statistics were computed using two-proportions z-test. Arrows represent genes which exceed the plot range. The dashed line represents the p = 0.05 threshold for the gnomAD dataset analysis. Colored genes are those with p-values < 0.05 in both the gnomAD non-UKB exomes and UKB WGS datasets.
Figure 6:
Figure 6:. Overrepresentation of neurodevelopmental, epigenetic and autism-related genes among those showing sex bias in variant frequencies
Overrepresentation analysis of genes found in both gnomAD and UKB with (A) female overrepresentation and (B) male overrepresentation using the reactome pathways gene sets. (C) Overlap of genes that show female overrepresentation in gnomAD and UKB datasets with epigenetic machinery genes. (D) Overlap of genes that show male overrepresentation in gnomAD and UKB datasets with epigenetic machinery genes. The p values and odds ratios for the overlaps were calculated using Fisher’s exact test with a background of 19980 genes (number of protein coding genes in GENCODE hg38). (E) Genes with male or female overrepresentation in gnomAD and UKB that overlap with SFARI autism candidate genes. SFARI gene score is shown on the x-axis, 1: High confidence, 2: Strong candidate, or 3: Suggestive evidence. The male - female aggregated alternate allele frequency difference is depicted by the color of the circles and −log10 p-value is depicted by the size of the circles.

Similar articles

References

    1. Pilarowski G. O. et al. Missense variants in the chromatin remodeler CHD1 are associated with neurodevelopmental disability. J Med Genet 55, 561–566 (2018). 10.1136/jmedgenet-2017-104759 - DOI - PMC - PubMed
    1. Loomes R., Hull L. & Mandy W. P. L. What Is the Male-to-Female Ratio in Autism Spectrum Disorder? A Systematic Review and Meta-Analysis. Journal of the American Academy of Child & Adolescent Psychiatry 56, 466–474 (2017). 10.1016/j.jaac.2017.03.013 - DOI - PubMed
    1. Bölte S. et al. Sex and gender in neurodevelopmental conditions. Nat Rev Neurol 19, 136–159 (2023). 10.1038/s41582-023-00774-6 - DOI - PMC - PubMed
    1. Sunwoo Y., Seo S. H., Kim H.-J., Park M. S. & Cho A. Variant of CHD1 gene resulting in a Korean case of Pilarowski-Bjornsson syndrome. J Genet Med 19, 111–114 (2022). 10.5734/JGM.2022.19.2.111 - DOI
    1. Al-Aamri M., Alshaqaq M. & Al-Abdi S. Y. A Saudi Girl With Co-occurring CHD1 (Pilarowski-Bjornsson Syndrome) and ASH1L Gene Variants. Cureus 15, e49905 (2023). 10.7759/cureus.49905 - DOI - PMC - PubMed

Publication types

LinkOut - more resources