. 2025 May 2:16:1578877.
doi: 10.3389/fphar.2025.1578877. eCollection 2025.

Gen-miR-5 derived from Gentianella acuta inhibits PFKP to prevent fibroblast activation and alleviate myocardial fibrosis

Affiliations

Gen-miR-5 derived from Gentianella acuta inhibits PFKP to prevent fibroblast activation and alleviate myocardial fibrosis

Hongyao Ge et al. Front Pharmacol. .

Abstract

Introduction: Myocardial fibrosis (MF) is a key pathological change in heart failure, and lactate a product of glycolysis, is an important component affecting the process of MF. miRNAs derived from Gentianella acuta (G. acuta) have been shown to effectively treat cardiac remodeling. However, whether G. acuta-derived Gen-miR-5 can effectively improve MF remains to be elucidated. This study seeks to explore the pharmacological effects and underlying molecular mechanisms of Gen-miR-5 in the context of Angiotensin II (Ang II) -induced MF.

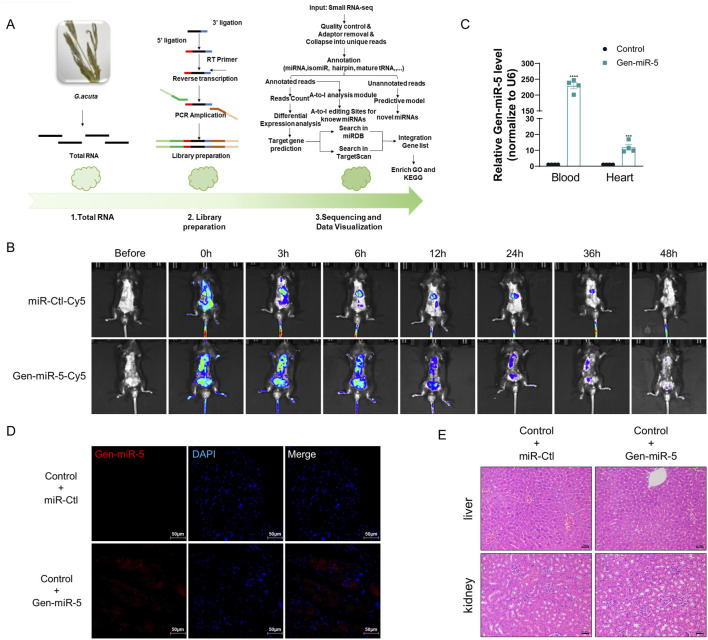
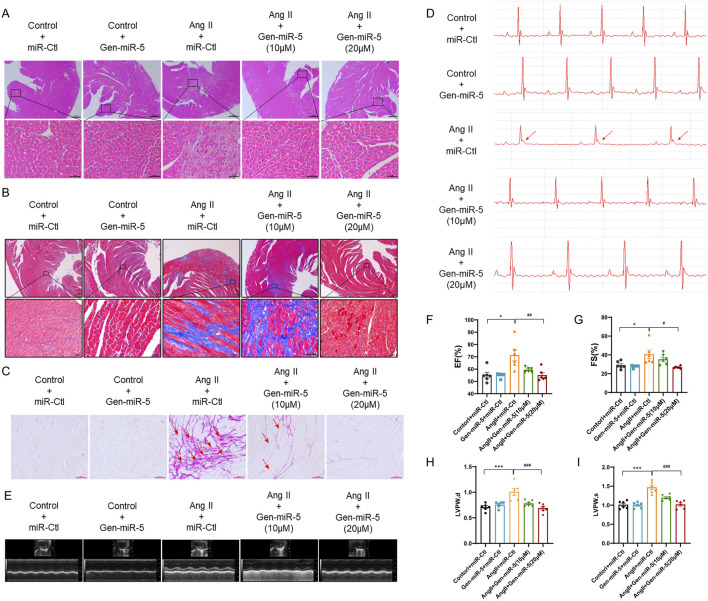
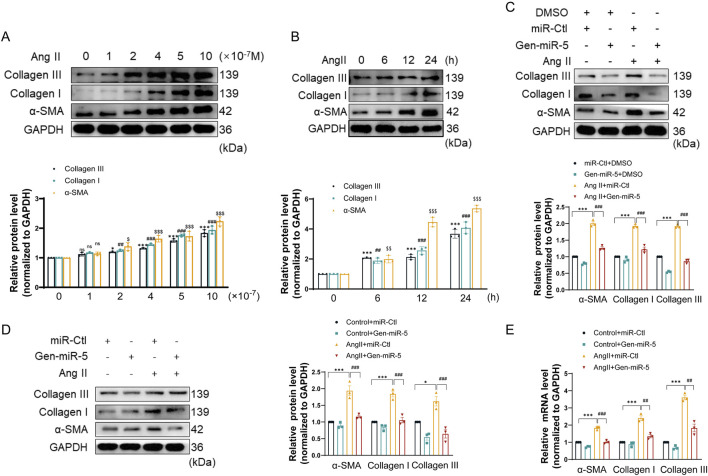
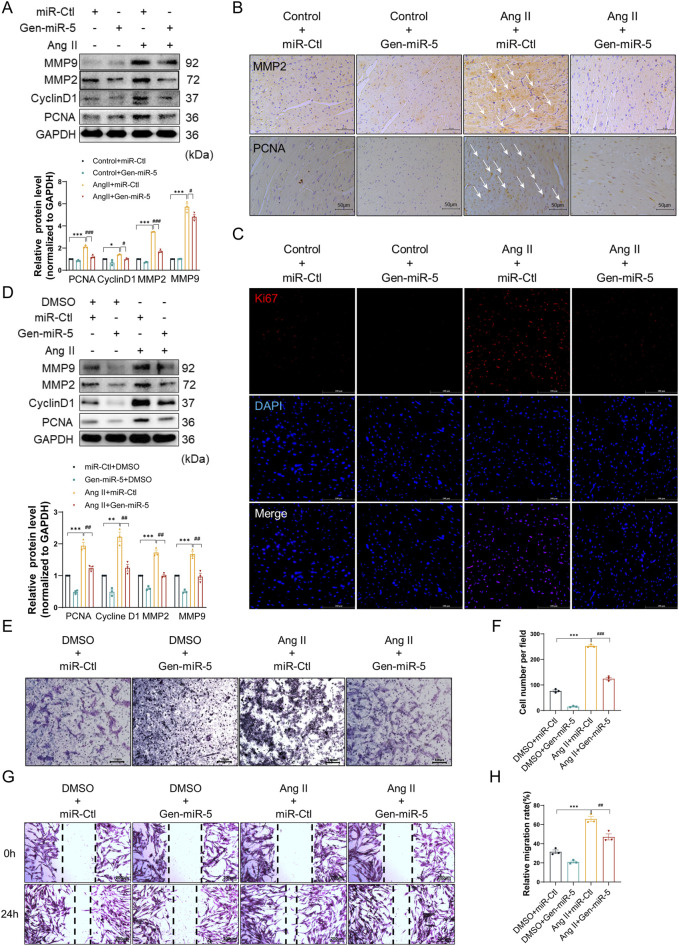
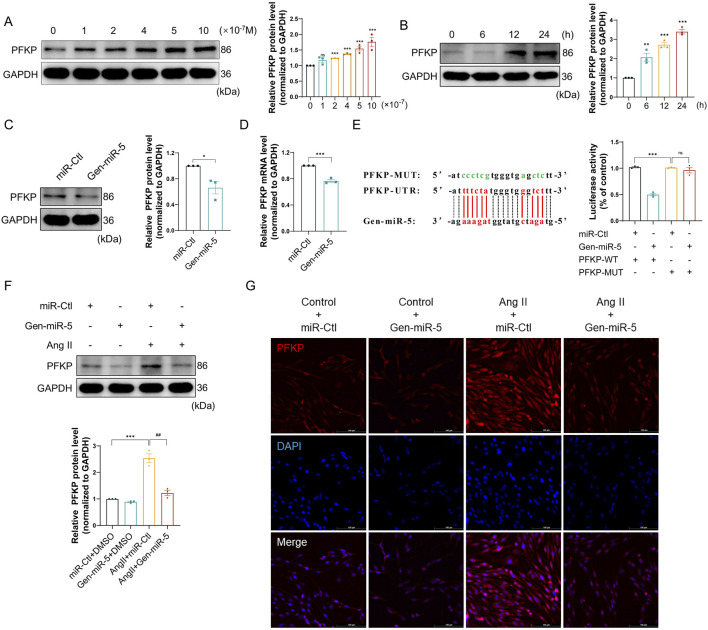
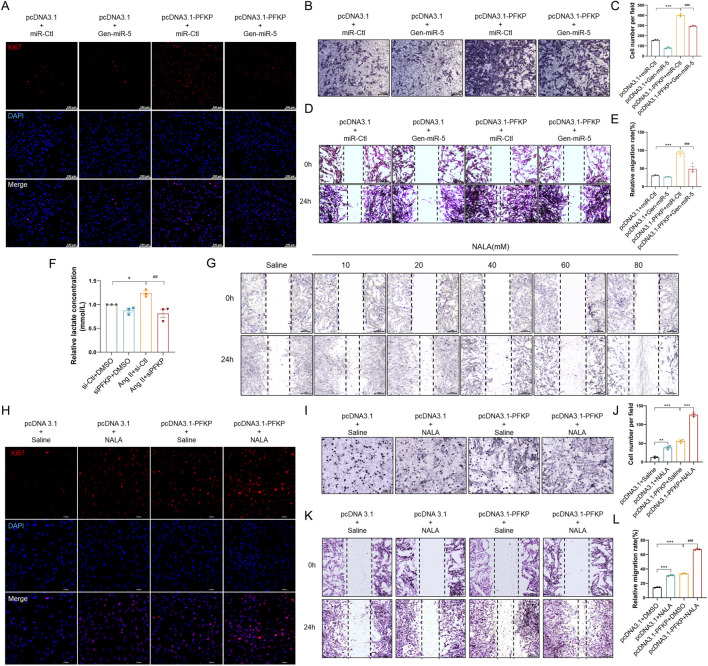
Methods: A mouse model of MF was established by subcutaneous infusion of Ang II using osmotic pumps, and then administration of Gen-miR-5 by injection. The effects of Gen-miR-5 in reducing MF and exerting cardioprotective actions were evaluated through pathological morphological analysis and echocardiography. The targeting effect of Gen-miR-5 on PFKP was assessed through dual-luciferase reporter gene assays. Cardiac fibroblasts (CFs) migration abilities were evaluated through wound healing assay and transwell assays. Additionally, the role of Gen-miR-5 in fibroblast activation was investigated using gain- and loss-of-function experiments, and immunofluorescence.

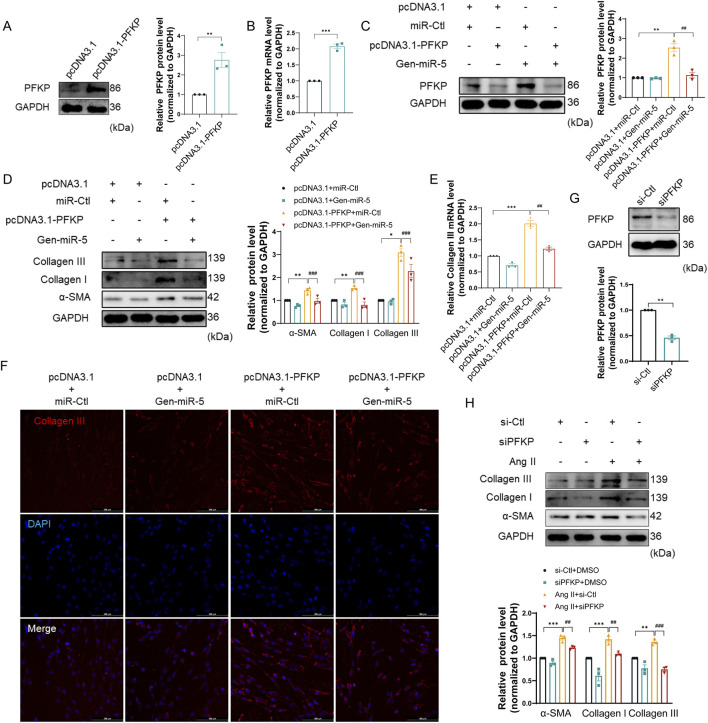
Results: This study identified six novel specific miRNAs in G. acuta, among which Gen-miR-5 can be absorbed by mice, stably exists in cardiac tissue, and targets the PFKP 3' UTR to exert cross-kingdom regulatory effects. PFKP, as a key rate-limiting enzyme in the glycolytic pathway, increases lactate accumulation and promotes the proliferation and migration of CFs, thereby facilitating the development of MF. In contrast, Gen-miR-5 alleviates MF by inhibiting this process.

Discussion: In conclusion, we have elucidated for the first time the pharmacological effects of Gen-miR-5, derived from G. acuta, in inhibiting MF. Gen-miR-5 exerts its cardioprotective effects by targeting and inhibiting the expression of the key glycolytic enzyme PFKP, induced by Ang II, regulating lactate metabolism in fibroblast, and preventing the transformation of fibroblasts into myofibroblasts, ultimately alleviating MF. This study demonstrates that Gen-miR-5 is a potential therapeutic agent for improving cardiac remodeling.

Keywords: PFKP; fibroblast activation; lactate; myocardial fibrosis; plant-derived miRNAs.


Conflict of interest statement

The authors declare that the research was conducted in the absence of any commercial or financial relationships that could be construed as a potential conflict of interest.

Figures

FIGURE 1
FIGURE 1
Gen-miR-5 specifically present in G.acuta might enter the mouse body after exogenous administration to mice (A) Flowchart of High-Throughput Sequencing and Bioinformatics Analysis. (B) Schematic illustration of in vivo imaging of Gen-miR-5 in mice. (C) miRNA was extracted from blood and cardiac tissues and treated with sodium periodate, followed by qRT-PCR to assess the expression levels of Gen-miR-5. Values are expressed as mean ± SEM. *** P < 0.001, **** P < 0.0001 compared to the corresponding control group (n = 4). (D) Gen-miR-5 in cardiac tissue was detected using RNA fluorescence in situ hybridization. Red fluorescence indicates Gen-miR-5 and blue fluorescence marks the nuclei. Scale bar = 50 μm. (E) H&E staining of mouse liver and kidney tissue sections. Scale bar = 2 mm.
FIGURE 2
FIGURE 2
Gen-miR-5 inhibits myocardial fibrosis C57BL/6 mice were subcutaneously infused with Ang II (1.5 mg/kg/day) or an equivalent volume of saline, continuously for 2 weeks, while Gen-miR-5 was administered orally every 2 days (A) H&E staining of cross-sectional slices of cardiac tissue. The white arrow indicates the structural changes and inflammatory infiltration occurring in the cardiac tissue. Scale bar = 20 μm. (B) Masson’s trichrome staining. The white arrow indicates the deposition of collagen fibers. Scale bar = 20 μm. (C) Sirius Red staining. The red arrow indicates the deposition of collagen fibers. Scale bar = 100 μm. (D) The electrocardiogram represents the image. The red arrow indicates the ST-segment elevation. (E) Representative echocardiogram images. (F–I) Ejection fraction (EF), fractional shortening (FS), and left ventricular posterior wall (LVPW) thickness at end-systole and end-diastole. Values are expressed as mean ± SEM. * P < 0.05, *** P < 0.001 compared to the corresponding control group. # P < 0.05, ### P < 0.001 compared to the corresponding Ang II + miR-Ctl group (n = 6).
FIGURE 3
FIGURE 3
Gen-miR-5 inhibits the activation of cardiac fibroblasts (A) After treating cardiac fibroblasts with varying doses of Ang II for 24 h, protein expression levels of Collagen III, Collagen I, and α-SMA were assessed using Western blot (n = 3). (B) Cardiac fibroblasts were treated with Ang II (1 μM) at specified times, and the protein expression levels of Collagen III, Collagen I, and α-SMA were assessed using Western blot (n = 3). (C) Protein expression levels of Collagen III, Collagen I, and α-SMA in cardiac fibroblasts were assessed using Western blot (n = 3). (D) Protein expression levels of Collagen III, Collagen I, and α-SMA in cardiac tissue were measured using Western blot (n = 3). (E) mRNA levels of Collagen III, Collagen I, and α-SMA in cardiac tissue were measured using qRT-PCR (n = 3). Values are expressed as mean ± SEM. * P < 0.05, *** P < 0.001, ## P < 0.01, ### P < 0.001, $ P < 0.05, $$ P < 0.01, $$$ P < 0.001 compared to the corresponding control group.
FIGURE 4
FIGURE 4
Gen-miR-5 inhibits Ang II-induced CF proliferation and migration (A) Protein expression levels of MMP9, MMP2, CyclinD1, and PCNA in cardiac tissue were assessed using Western blot (n = 3). (B) Immunohistochemical staining was used to assess the expression of MMP2 and PCNA in cardiac tissue. Scale bar = 50 μm. (C) Immunofluorescence staining was used to assess the expression of Ki67 in cardiac tissue. Red fluorescence indicates Ki67 and blue fluorescence marks the nuclei. Scale bar = 50 μm. (D) Protein expression levels of MMP9, MMP2, CyclinD1, and PCNA in cardiac fibroblasts were assessed using Western blot (n = 3). (E) Transwell assay used to assess the invasiveness of cardiac fibroblasts. Scale bar = 100 μm. (F) Quantification of cell invasion rate. (G) Wound healing assay to assess cardiac fibroblast migration. Scale bar = 200 μm. (H) Quantification of cell migration rate. Values are expressed as mean ± SEM. * P < 0.05, ** P < 0.01, *** P < 0.001, # P < 0.05, ## P < 0.01, ### P < 0.001 compared to the corresponding control group.
FIGURE 5
FIGURE 5
Gen-miR-5 can inhibit the expression of PFKP induced by Ang II (A) After treating cardiac fibroblasts with varying doses of Ang II for 24 h, PFKP protein expression levels were assessed using Western blot (n = 3). (B) Cardiac fibroblasts were treated with Ang II (1 μM) at specified times, and PFKP protein expression levels were assessed using Western blot (n = 3). (C) PFKP protein expression levels in cardiac fibroblasts were assessed using Western blot (n = 3). (D) PFKP mRNA levels in cardiac fibroblasts were measured using qRT-PCR (n = 3). (E) Dual-luciferase reporter assay was used to determine the binding interaction between PFKP and Gen-miR-5 in cardiac fibroblasts. The binding sites of Gen-miR-5 on the 3′ UTR of PFKP mRNA are marked in red, while the mutation sites are marked in green. (F) PFKP protein expression levels in cardiac fibroblasts were assessed using Western blot (n = 3). (G) Immunofluorescence staining was used to assess the expression of PFKP in cardiac fibroblasts. Red fluorescence indicates PFKP and blue fluorescence marks the nuclei. Scale bar = 100 μm. Values are expressed as mean ± SEM. * P < 0.05, ** P < 0.01, *** P < 0.001 compared to the corresponding control group. ## P < 0.01 compared to the corresponding Ang II + miR-Ctl group.
FIGURE 6
FIGURE 6
Gen-miR-5 targets PFKP to inhibit the proliferation and migration of CFs (A) PFKP protein expression levels in cardiac fibroblasts were assessed using Western blot (n = 3). (B) PFKP mRNA levels in cardiac fibroblasts were measured using qRT-PCR (n = 3). (C) PFKP protein expression levels in cardiac fibroblasts were assessed using Western blot (n = 3). (D) Protein expression of Collagen III, Collagen I, and α-SMA in cardiac fibroblasts was detected by Western blot (n = 3). (E) Collagen III mRNA levels in cardiac fibroblasts were detected by qRT-PCR (n = 3). (F) Collagen III expression in cardiac fibroblasts was detected by immunofluorescence staining. Red fluorescence is Collagen III and blue fluorescence is the nucleus. (G) PFKP protein expression levels in cardiac fibroblasts were assessed using Western blot (n = 3). (H) Protein expression of Collagen III, Collagen I, and α-SMA in cardiac fibroblasts was detected by Western blot (n = 3). Values are expressed as mean ± SEM. *P < 0.05, **P < 0.01, ***P < 0.001, ##P < 0.01,###P < 0.001 compared to the corresponding control group.
FIGURE 7
FIGURE 7
PFKP synergistically induces CF proliferation and migration in conjunction with lactate (A) Ki67 expression in cardiac fibroblasts was detected by immunofluorescence staining. Red fluorescence is Ki67 and blue fluorescence is nucleus. Scale bar = 100 μm. (B) Transwell detection of myocardial fibroblast invasion. Scale bar = 100 μm. (C) Quantification of cell invasion rate. (D) Cell wound healing assay to detect myocardial fibroblast migration. Scale bar = 200 μm. (E) Quantification of cell migration rate. (F) Changes in lactate levels. (G) Wound healing assay to assess cardiac fibroblast migration. Scale bar = 200 μm. (H) Ki67 expression in cardiac fibroblasts was detected by immunofluorescence staining. Red fluorescence is Ki67 and blue fluorescence is nucleus. Scale bar = 100 μm. (I) Transwell detection of myocardial fibroblast invasion. Scale bar = 100 μm. (J) Quantification of cell invasion rate. (K) Cell wound healing assay to detect myocardial fibroblast migration. Scale bar = 200 μm. (L) Quantification of cell migration rate. Values are expressed as mean ± SEM. ***P < 0.001, ###P < 0.001 compared to the corresponding control group.

Similar articles

References

    1. Al Hattab D., Czubryt M. P. (2017). A primer on current progress in cardiac fibrosis. Can. J. Physiology Pharmacol. 95 (10), 1091–1099. 10.1139/cjpp-2016-0687 - DOI - PubMed
    1. Bertero E., Maack C. (2018). Metabolic remodelling in heart failure. Nat. Rev. Cardiol. 15 (8), 457–470. 10.1038/s41569-018-0044-6 - DOI - PubMed
    1. Chen Q., Zhang F., Dong L., Wu H., Xu J., Li H., et al. (2021). SIDT1-dependent absorption in the stomach mediates host uptake of dietary and orally administered microRNAs. Cell Res. 31 (3), 247–258. 10.1038/s41422-020-0389-3 - DOI - PMC - PubMed
    1. Chen Z. T., Gao Q. Y., Wu M. X., Wang M., Sun R. L., Jiang Y., et al. (2021). Glycolysis inhibition alleviates cardiac fibrosis after myocardial infarction by suppressing cardiac fibroblast activation. Front. Cardiovasc Med. 8, 701745. 10.3389/fcvm.2021.701745 - DOI - PMC - PubMed
    1. Chin A. R., Fong M. Y., Somlo G., Wu J., Swiderski P., Wu X., et al. (2016). Cross-kingdom inhibition of breast cancer growth by plant miR159. Cell Res. 26 (2), 217–228. 10.1038/cr.2016.13 - DOI - PMC - PubMed

LinkOut - more resources