

Establishing a scalable perfusion strategy for the manufacture of CAR-T cells in stirred-tank bioreactors using a quality-by-design approach
- PMID: 40385527
- PMCID: PMC12079453
- DOI: 10.1002/btm2.10753
Establishing a scalable perfusion strategy for the manufacture of CAR-T cells in stirred-tank bioreactors using a quality-by-design approach
Abstract
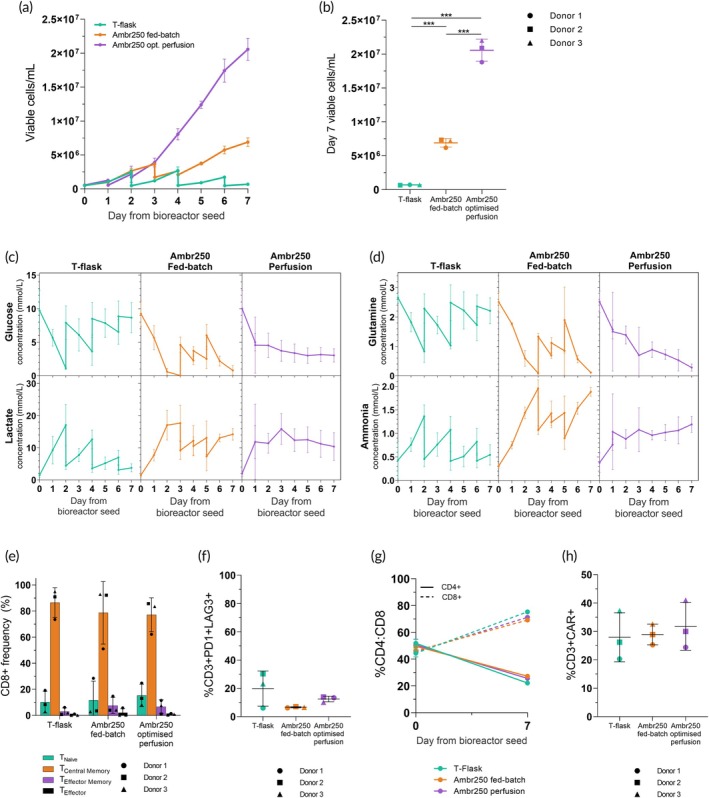
Chimeric antigen receptor T cell (CAR-T) therapies show high remission rates for relapsed and refractory leukemia and lymphoma. However, manufacturing challenges hinder their commercial viability and patient accessibility. This study applied quality-by-design principles to identify perfusion critical process parameters for CAR-T expansion in stirred tank bioreactors to maximize yields. A design of experiments in the Ambr® 250 High Throughput Perfusion small-scale bioreactor revealed that earlier perfusion starts (48 h vs. 96 h post-inoculation) and higher perfusion rates (1.0 VVD vs. 0.25 VVD) significantly increased cytotoxic CAR-T cell yields without compromising critical quality attributes. Optimizing perfusion improved growth kinetics and yields across donor samples, achieving densities >21 × 106 cells/mL in 7 days, outperforming traditional fed-batch and static flask cultures. This study underscores the importance of optimizing perfusion parameters to maximize CAR-T yields and quality and highlights the utility of scale-down models in reducing time, costs and risks associated with process development.
Keywords: CAR‐T; perfusion, immunotherapy; process control; process intensification; quality‐by‐design; stirred‐tank bioreactor.
© 2025 The Author(s). Bioengineering & Translational Medicine published by Wiley Periodicals LLC on behalf of American Institute of Chemical Engineers.
Conflict of interest statement
There are no conflicts of interest to declare for Hood T., Springuel P., and Rafiq Q. A. It should be noted that authors Slingsby F., Sandner V., Geis W., Schmidberger T., Bevan N., Vicard Q., Hengst J., and Dianat N. were or are Sartorius employees during the experimental studies and preparation of the manuscript.
Figures


Similar articles
-
Optimising and adapting perfusion feeds in serum-free medium to intensify CAR-T cell expansion in stirred-tank bioreactors.Front Bioeng Biotechnol. 2025 Jun 2;13:1593895. doi: 10.3389/fbioe.2025.1593895. eCollection 2025. Front Bioeng Biotechnol. 2025. PMID: 40529176 Free PMC article.
-
A quality-by-design approach to improve process understanding and optimise the production and quality of CAR-T cells in automated stirred-tank bioreactors.Front Immunol. 2024 Apr 9;15:1335932. doi: 10.3389/fimmu.2024.1335932. eCollection 2024. Front Immunol. 2024. PMID: 38655265 Free PMC article.
-
Establishing the scalable manufacture of primary human T-cells in an automated stirred-tank bioreactor.Biotechnol Bioeng. 2019 Oct;116(10):2488-2502. doi: 10.1002/bit.27088. Epub 2019 Jul 9. Biotechnol Bioeng. 2019. PMID: 31184370
-
Recent Advances in the Development of Bioreactors for Manufacturing of Adoptive Cell Immunotherapies.Bioengineering (Basel). 2022 Dec 15;9(12):808. doi: 10.3390/bioengineering9120808. Bioengineering (Basel). 2022. PMID: 36551014 Free PMC article. Review.
-
Bioreactors for high cell density and continuous multi-stage cultivations: options for process intensification in cell culture-based viral vaccine production.Appl Microbiol Biotechnol. 2016 Mar;100(5):2121-32. doi: 10.1007/s00253-015-7267-9. Epub 2016 Jan 13. Appl Microbiol Biotechnol. 2016. PMID: 26758296 Free PMC article. Review.
Cited by
-
Optimising and adapting perfusion feeds in serum-free medium to intensify CAR-T cell expansion in stirred-tank bioreactors.Front Bioeng Biotechnol. 2025 Jun 2;13:1593895. doi: 10.3389/fbioe.2025.1593895. eCollection 2025. Front Bioeng Biotechnol. 2025. PMID: 40529176 Free PMC article.
References
-
- Bersenev A, Kili S. Management of ‘out of specification’ commercial autologous CAR‐T cell products. Cell Gene Ther Insights. 2018;4(11):1051‐1058. doi:10.18609/cgti.2018.105 - DOI
LinkOut - more resources
Full Text Sources
