. 2025 Jan 27;10(3):e10750.
doi: 10.1002/btm2.10750. eCollection 2025 May.

Investigating the impact of synonymous gene recoding on a recombinantly expressed monoclonal antibody under different process parameters

Affiliations

Investigating the impact of synonymous gene recoding on a recombinantly expressed monoclonal antibody under different process parameters

Nayiri M Kaissarian et al. Bioeng Transl Med. .

Abstract

Monoclonal antibodies (mAbs) are commonly used biologic therapeutics with a wide variety of clinical applications. During the development process, manufacturers consider different production parameters to improve protein yield and achieve appropriate quality of the product. Synonymous gene recoding is one of such attributes that is often considered and implemented to enhance protein expression. However, it has to be used with caution, as it may lead to protein misfolding and ER stress, which complicates efforts to manufacture the desired mAb. To investigate how changing mRNA sequence composition under different protein production parameters might affect the quality of recombinantly produced mAbs, we performed a comprehensive and systematic study assessing impact of synonymous gene recoding (commonly referred to as codon optimization) strategies in the context of varied cell culture parameters on product quality, biochemical and functional characteristics. We report the impact of these parameters on mAb glycosylation profiles, charge variant profile, aggregation, fragmentation, and mAb functional response from combinations of different production parameters. These results uncovered a complex interplay of sequence composition and manufacturing parameters and emphasize the importance of assessing changes to key quality attributes when optimizing mAb manufacturing, including the use of synonymous gene recoding.

Keywords: CHO cells; codon optimization; monoclonal antibody; process changes.


Conflict of interest statement

Anton A. Komar is a founder of SATOR Therapeutics LLC. Anton A. Komar's spouse is a founder of DAPCEL, Inc. and SATOR Therapeutics LLC. The other authors declare no competing interests.

Figures

FIGURE 1
FIGURE 1
Properties of mAb1‐IgG4 heavy chain (HC) and light chain (LC) gene sequences. %MinMax values were plotted by codon position for (a) HC and (b) LC sequences. Negative and positive values indicate the presence of rarer and more optimized codons, respectively. The seven‐codon average relative synonymous codon usage (RSCU) for (c) HC and (d) LC, and the seven‐codon average of relative synonymous codon pair usage (RSCPU) were plotted for (e) HC and (f) LC sequences. IgG4 sequence domains are overlayed on the plots. %MinMax, RSCU, and RSCPU calculations overlap for a majority of CO‐1 and CO‐2 HC and LC NT sequences because they only differ by 11 codons per HC and LC comparison. See also Figures S1 and S2.
FIGURE 2
FIGURE 2
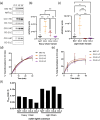
Translation Kinetics of three different codon optimized (CO) IgG4 heavy chain (HC) and light chain (LC) compared to the native (NAT) sequence. (a) Representative radiograph of the translation rate (35S‐Met incorporation). (b) and (c) The arbitrary values obtained from phosphor imaging scans for products formed after 30 min were used to plot the scatter plot showing expression differences of (b) heavy chain (HC) and (c). light chain (LC). Bars represent mean ± SD. Each symbol represents one replicate. Two‐tailed Welch's t test. The arbitrary values obtained from phosphor imaging scans in Figure 1a were used to plot expression differences at 0, 10, 20, and 30 min of (d) HC and (e) LC. Bars represent mean ± SD. Each symbol represents one replicate. F. One phase exponential association curve fitting was used to calculate kinetics parameters of the in vitro translation reaction. See Appendix S2 for more details on statistics and curve fitting.
FIGURE 3
FIGURE 3
Schematic of methods used to manufacture material used for analysis. The Native (NAT) and three codon optimized (CO‐1, CO‐2, CO‐3) mAb1‐IgG4 heavy chain (HC) and light chain (LC) nucleotide (NT) sequences were transfected by electroporation into CHO cells by random (RI) or targeted integration (TI). Stable bulk culture (bulk) cells were sorted into single‐cell colonies by FACS. Clonally‐derived cell lines (CDCLs) were chosen based on specific productivity (SP) and gene copy number (GCN) for further evaluation. Bulk and CDCL cells were grown in two production scales, shake flask (SF) and 36L. Protein A (PrA)‐captured purified protein from all groups were analyzed by the methods listed at the bottom of the figure. This figure was created with BioRender.com.
FIGURE 4
FIGURE 4
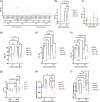
Synonymous gene recoding and process parameters affect product quality attributes (PQAs). Higher titer is observed from codon optimized RI‐CDCLs reported by (a) each IgG4 protein sample, (b) grouping the different CLG‐CLF‐PS variables, and (c) grouping the different NT sequences. Observations made from glycan analysis include PS and CLF affected (d) G0F content, (e) G1F content, and (f) G2F content regardless of CLG method. (g) Codon optimization affected G0 content among protein purified from CDCLs but not stable bulk culture cells. (h) Differences in carbonyl type oxidation is observed from the hydroxylamine species (HRS) assay. (i) Changes in total aggregation is observed by SEC. In both integration methods, less aggregation is observed in CDCL‐36 L than other groups. Except for CDCL‐36L, higher aggregates are observed in RI than TI. Bars represent mean ± SD. Each symbol represents one sample. See Appendix S2 for details from Welch's t tests for Figure 3b,d–i. See also Tables S1–S9. SEC, size exclusion chromatography.
FIGURE 5
FIGURE 5
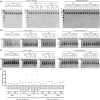
Composition of mAb1‐IgG4 purified protein. (a) Random integration (RI) and targeted integration (TI) samples were analyzed by nonreducing SDS‐PAGE followed by silver staining. A strong band is observed between 185 and 270 kDa in all samples in the RI‐bulk‐SF (samples 1–4) and TI‐CDCL‐SF (samples 31–34) groups. Stronger fragments are observed <65 kDa in: two CO samples from the RI‐Bulk‐36L group, select samples from the RI‐CDCL‐36L group, and the NAT and CO‐2 samples from the TI‐Bulk‐36L group. It is observed that protein composition is not consistent among protein manufactured from different synonymous nucleotide sequences within these groups. RI and TI samples were separated by NativePAGE in (b) dark blue cathode buffer (0.02% G‐250) for ~1/3 of the gel following by light blue cathode buffer (0.002% G‐250) for the remainder of the gel or in (c) light blue cathode buffer (0.002% G‐250) only, followed by silver staining. Samples 14 and 21 are from the shake flask and 36L groups, respectively, but are from the same cell line (RI‐CDCL‐CO‐3 A) and exhibit stronger bands than other samples at ~480 kDa when separated by light blue cathode buffer (panel c). The same is not observed for the other cell line of the same variables (RI‐CDCL‐CO‐3 B, panel c samples 15 and 22). (d) RI‐CDCL CO‐3 A in shake flask and 36L production scales is observed to have a higher percentage of basic variants (30.11% and 31.35%, respectively) than RI‐CDCL CO‐3 B, which falls within the range of the other samples (4.74%–12.97%). See also Figure S5.
FIGURE 6
FIGURE 6
Process parameters affect efficacy and potency of mAb1‐IgG4 in ELISA. (a) The relative response at the highest dose of mAb1‐IgG4 was calculated for each sample relative to the response of the reference standard, RI‐NAT‐CDCL‐36 L. The RI‐Bulk‐SF and TI‐CDCL‐SF samples have significantly higher relative response than the reference (p < 0.0001) as observed on the dose–response curves. These samples also have a strong presence of an oligomer on nonreducing SDS‐PAGE gels (Figure 4a,b). The means of TI‐Bulk‐SF‐NAT (p = 0.0017) and TI‐Bulk‐SF‐CO‐3 (p = 0.021) were also found to be statistically higher than the reference (one‐way ANOVA with Dunnett's multiple comparisons test). Bars represent mean ± SD. Each symbol represents one replicate. (b) The RI‐Bulk‐SF group had higher average relative potency than RI‐bulk‐36L, RI‐CDCL‐SF, and TI‐Bulk‐SF groups (Welch's t tests). The difference between the means of RI‐CDCL SF and 36L groups while significant, are within 80%–120% method variability. Bars represent mean ± SD. Each symbol represents one sample. See Appendix S2 for details on all statistical tests performed. See also Figures S4 and S6.

Similar articles

References

    1. Urquhart L. Top companies and drugs by sales in 2022. Nat Rev Drug Discov. 2023;22(4):260. - PubMed
    1. Hodgson J. Drug pipeline 3Q23 – ERT, bispecifics and CRISPR in sickle cell disease. Nat Biotechnol. 2023;41(11):1498‐1500. - PubMed
    1. Jarasch A, Koll H, Regula JT, Bader M, Papadimitriou A, Kettenberger H. Developability assessment during the selection of novel therapeutic antibodies. J Pharm Sci. 2015;104(6):1885‐1898. - PubMed
    1. Reusch D, Tejada ML. Fc glycans of therapeutic antibodies as critical quality attributes. Glycobiology. 2015;25(12):1325‐1334. - PMC - PubMed
    1. Li Z, Du X, Wang YC. A survey of FDA approved monoclonal antibodies and fc‐fusion proteins for manufacturing changes and comparability assessment. Pharm Res. 2024;41(1):13‐27. - PubMed

LinkOut - more resources