. 2025 Feb 26;10(3):e10747.
doi: 10.1002/btm2.10747. eCollection 2025 May.

Integrated ATAC-seq and RNA-seq analysis identifies key regulatory elements in NK cells activated with feeder cells and IL-2

Affiliations

Integrated ATAC-seq and RNA-seq analysis identifies key regulatory elements in NK cells activated with feeder cells and IL-2

Pedram Motallebnejad et al. Bioeng Transl Med. .

Abstract

Natural killer (NK) cells are in development for allogeneic immunotherapy; however, for such use as off-the-shelf medicines, NK cells need to undergo ex vivo expansion, typically through activation with feeder cells and cytokines, to generate sufficient cells for clinical applications. Upon stimulation with feeder cells in the presence of cytokines, NK cells undergo profound changes in gene expression, altering their metabolic activity, cell cycle progression, and growth behavior, but the precise changes that drive this transformation remain poorly understood. In this study, we identified significant differences in the transcriptome and chromatin accessibility of NK cells 7 days after feeder cell and cytokine activation, with the changes even more pronounced in genome regions closer to enhancers. Several transcription factors, including AP-1, IRF4, STATs, T-bet, Eomes, and bHLHE40, which play key roles in NK cell development and immune response, exhibited differential binding activity between unstimulated and day 7 NK cells. Gene sets composed of target genes downstream of these transcription factors were also enriched at day 7, implying their involvement in NK cell activation. Moreover, we compared potential super-enhancer regions in NK cells before and after activation, combined with the transcriptional activity of nearby genes. We identified stable and transcriptionally active super-enhancers in unstimulated and day 7 NK cells, as well as those that form or disappear after co-culture initiation. The transcriptomic and epigenetic characterization of NK cells presented in this study could facilitate the ex vivo expansion and engineering of functionally superior NK cells.

Keywords: ATAC‐seq; NK cells; feeder cells; super‐enhancers; transcription factor.


Conflict of interest statement

The authors declare no conflicts of interest.

Figures

FIGURE 1
FIGURE 1
RNA‐seq results suggest changes in chromatin state of NK cells. (a) A schematic illustrating NK cell activation by feeder cells and IL‐2. (b) Average transcript abundance (n = 3, in TPM) of all TFs is plotted against the fold change in transcript expression. The dashed lines indicate FC = 2 and FC = 1/2. Some of the TFs with critical roles in immune response or cell proliferation are labeled. Red denotes DEGs. (c, d) Enriched functional classes in downregulated (c) and upregulated (d) DEGs by over‐representation analysis using gene ontology (GO) biological processes, GO cellular components, and GO molecular function data sets. The color bar represents −log10(p value), and the number of genes in each group is indicated by the size of the circle.
FIGURE 2
FIGURE 2
Changes in chromatin accessibility landscape of activated NK cells. (a) Distribution of ATAC peaks annotated to different genome regions and grouped by direction of accessibility changes between day 7 and unstimulated samples. The percentage of the top three genomic regions is shown. (b, c). The fold change in normalized peak signal for differentially accessible peaks (more and less accessible at day 7) and annotated to distal intergenic, promoter, and gene body (intron, exon, 5′ UTR, 3′ UTR). Whiskers extend 1.5 times the inter‐quartile range. (d) ATAC signals in the vicinity of the peak summits for unstimulated and day 7 samples of all three donors. The top 400 differentially accessible peaks with gain in accessibility and the top 400 peaks with reduction in accessibility were used for the plot. Shown are average signals (top row) and heatmaps (bottom rows). The top panel displays the average signal around the peak summits (blue: day 7; purple: unstimulated). The accompanying heatmaps (second and third panel) depict the normalized read density profiles around the summit of peaks, where each horizontal line represents one peak, and peaks are sorted based on log2FC (accessibility) in ascending order from top to bottom. (e) Fold change of accessibility of peaks annotated to promoter regions are plotted against the fold change in transcript abundance of the corresponding gene. The number of genes with |log2Accessibility FC| > 1 and |log2Transcript FC| > 1 for each quadrant is shown. The Pearson correlation values and statistics are shown at top of the plot.
FIGURE 3
FIGURE 3
Key TFs which impart large changes in binding activity on their TFBMs were identified. (a) Using chromVAR, TFs are ranked based on the standard deviation (variability) of the Z‐score of their TFBM. The TFs above the inflection point are shown in red and labeled in the zoomed‐in plot. (b) A volcano plot of –log10 (adj. p value) against the bias‐corrected deviation score of TFBMs, illustrating TFs which elicit significant changes in their TFBM accessibility in the positive or negative direction. The horizontal dashed line indicates adjusted p value = 0.05, and the vertical dashed lines show differences in deviation scores equaling 1 and −1. (c–e) Footprint plots of aggregated footprint signals of peaks centered around the consensus TFBM. The consensus logos are shown in the comparison plots. The dashed lines mark the border of motif site for each TF. Three plots for each TF represent the aggregated footprint signal for day 7, unstimulated, and the combined conditions for comparison. (f) TF target gene sets enriched in GSEA. Transcriptome of day 7 and unstimulated were used. The gene sets comprised of the target genes of each TF were retrieved from various databases and studies. The normalized enrichment score (NES) and p value for each gene set are also shown.
FIGURE 4
FIGURE 4
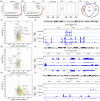
SEs in unstimulated and activated NK cells are identified. (a, b) ATAC‐seq peaks in unstimulated and day 7 NK cells, ordered by normalized read coverage after background subtraction, are plotted against normalized ranked peaks. The stitched peaks designated as SEs are located above the inflection point. The top SE peaks, based on their ATAC‐seq signal, are labeled. (c, d) Boxplots showing gene expression of SE associated genes, regular enhancer associated genes, and all other genes in unstimulated and day 7 NK cells. Whiskers extend 1.5 times the inter‐quartile range, and “x” represents the mean. (e) A Venn diagram illustrates the count of SEs exclusively present in unstimulated NK cells, those shared between unstimulated and day 7, and those exclusively found in day 7 NK cells. (f–h) Average abundance (displayed by Log2 (TPM + 1)) of genes assigned to SEs is plotted against the Log2fold change in gene expression for “shared”, “unstimulated only”, and “day 7 only” SEs, respectively. The vertical dashed lines show FC = 2 and FC = –2. Upregulated genes are shown in yellow, downregulated are shown in pink, and those that are not significantly changed in green. Some of the genes discussed in the manuscript are labeled. (i) Local genome view of representative shared SE with highly active and stable transcriptional activity. (j) Local genome view of a representative day 0 only SE with unstable transcriptional activity. (k) Local genome view of a representative day 7 only SE with unstable transcriptional activity. **** indicates p value <0.0001.

Similar articles

References

    1. Myers JA, Miller JS. Exploring the NK cell platform for cancer immunotherapy. Nat Rev Clin Oncol. 2021;18(2):85‐100. - PMC - PubMed
    1. Laskowski TJ, Biederstadt A, Rezvani K. Natural killer cells in antitumour adoptive cell immunotherapy. Nat Rev Cancer. 2022;22(10):557‐575. - PMC - PubMed
    1. Prager I, Watzl C. Mechanisms of natural killer cell‐mediated cellular cytotoxicity. J Leukoc Biol. 2019;105(6):1319‐1329. - PubMed
    1. Xie G, Dong H, Liang Y, Ham JD, Rizwan R, Chen J. CAR‐NK cells: a promising cellular immunotherapy for cancer. EBioMedicine. 2020;59:102975. - PMC - PubMed
    1. Heipertz EL, Zynda ER, Stav‐Noraas TE, et al. Current perspectives on “off‐the‐shelf” allogeneic NK and CAR‐NK cell therapies. Front Immunol. 2021;12:732135. - PMC - PubMed

LinkOut - more resources