

AI-assisted warfarin dose optimisation with CURATE.AI for clinical impact: Retrospective data analysis
- PMID: 40385544
- PMCID: PMC12079355
- DOI: 10.1002/btm2.10757
AI-assisted warfarin dose optimisation with CURATE.AI for clinical impact: Retrospective data analysis
Abstract
Background: Standard-of-care for warfarin dose titration is conventionally based on physician-guided drug dosing. This may lead to frequent deviations from target international normalized ratio (INR) due to inter- and intra-patient variability and may potentially result in adverse events including recurrent thromboembolism and life-threatening hemorrhage.
Objectives: We aim to employ CURATE.AI, a small-data, artificial intelligence-derived platform that has been clinically validated in a range of indications, to optimize and guide warfarin dosing.
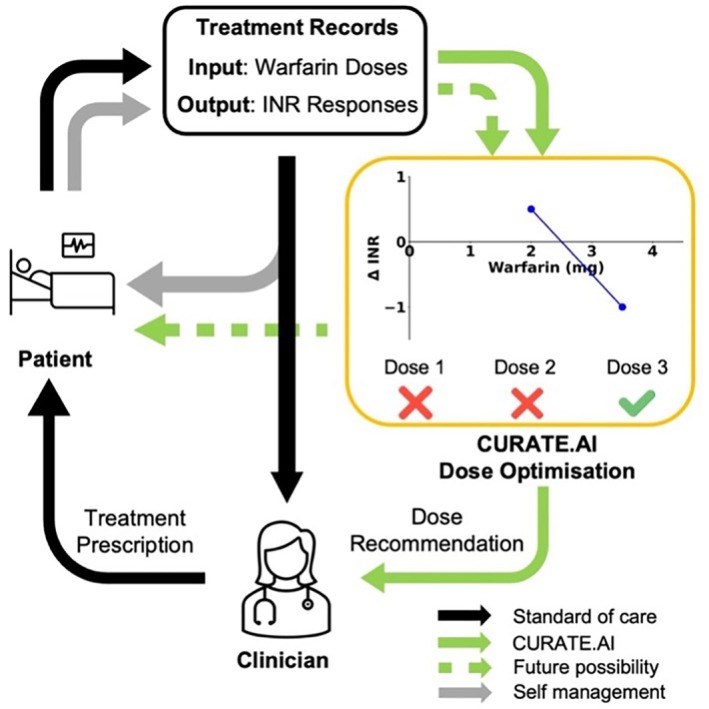
Patients/methods: A personalized CURATE.AI response profile was generated using warfarin dose (inputs) and corresponding change in INR between two consecutive days (phenotypic outputs) and used to identify and recommend an optimal dose to achieve target treatment outcomes. CURATE.AI's predictive performance was then evaluated with a set of metrics that assessed both technical performance and clinical relevance.
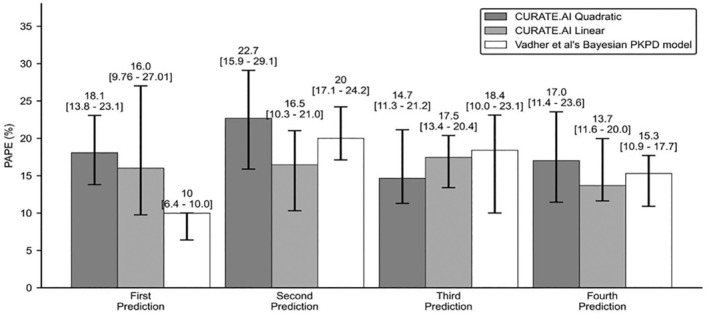
Results and conclusions: In this retrospective study of 127 patients, CURATE.AI fared better in terms of Percentage Absolute Prediction Error and Percentage Prediction Error of 20% compared to other models in the literature. It also had negligible underprediction bias, potentially translating into lower bleeding risk. Modeled potential time in therapeutic range with CURATE.AI was not significantly different from physician-guided dosing, so it is on-par yet provides a systematic approach to warfarin dosing, easing the mental-burden on guesswork by physicians.This study lays the groundwork for the prospective study of CURATE.AI as a clinical decision support system. CURATE.AI may facilitate the effective use of affordable warfarin with a well-established safety profile, without the need for costly, new oral anticoagulants. This can have significant impact both on the individual and public health.
Keywords: artificial intelligence; blood coagulation; clinical; decision support systems; precision medicine; warfarin.
© 2025 The Author(s). Bioengineering & Translational Medicine published by Wiley Periodicals LLC on behalf of American Institute of Chemical Engineers.
Conflict of interest statement
Mathias Egermark is an employee of Roche Diagnostics and shareholder in F. Hoffmann‐La Roche Lester W. J. Tan, Anh T. L. Truong, Kirthika Kumar, Shi‐Bei Tan, Agata Blasiak and Dean Ho are co‐inventors of previously filed pending patents on artificial intelligence‐based therapy development. Dean Ho is a co‐founder and shareholder of KYAN Therapeutics, which has licensed intellectual property pertaining to AI‐based oncology drug development. The rest of the authors declare no conflict of interests.
Figures


Similar articles
-
Personalised, Rational, Efficacy-Driven Cancer Drug Dosing via an Artificial Intelligence SystEm (PRECISE): A Protocol for the PRECISE CURATE.AI Pilot Clinical Trial.Front Digit Health. 2021 Apr 12;3:635524. doi: 10.3389/fdgth.2021.635524. eCollection 2021. Front Digit Health. 2021. PMID: 34713106 Free PMC article.
-
CURATE.AI-assisted dose titration for anti-hypertensive personalized therapy: study protocol for a multi-arm, randomized, pilot feasibility trial using CURATE.AI (CURATE.AI ADAPT trial).Eur Heart J Digit Health. 2023 Oct 24;5(1):41-49. doi: 10.1093/ehjdh/ztad063. eCollection 2024 Jan. Eur Heart J Digit Health. 2023. PMID: 38264697 Free PMC article.
-
Personalised Dosing Using the CURATE.AI Algorithm: Protocol for a Feasibility Study in Patients with Hypertension and Type II Diabetes Mellitus.Int J Environ Res Public Health. 2022 Jul 23;19(15):8979. doi: 10.3390/ijerph19158979. Int J Environ Res Public Health. 2022. PMID: 35897349 Free PMC article.
-
Optimal Warfarin Management for the Prevention of Thromboembolic Events in Patients with Atrial Fibrillation: A Systematic Review of the Clinical Evidence [Internet].Ottawa (ON): Canadian Agency for Drugs and Technologies in Health; 2011 Nov. Ottawa (ON): Canadian Agency for Drugs and Technologies in Health; 2011 Nov. PMID: 24278997 Free Books & Documents. Review.
-
Genotype-guided warfarin dosing vs. conventional dosing strategies: a systematic review and meta-analysis of randomized controlled trials.Br J Clin Pharmacol. 2018 Sep;84(9):1868-1882. doi: 10.1111/bcp.13621. Epub 2018 Jun 21. Br J Clin Pharmacol. 2018. PMID: 29704269 Free PMC article.
Cited by
-
Artificial intelligence in clinical thrombosis and hemostasis: A review.Res Pract Thromb Haemost. 2025 Jul 24;9(5):102984. doi: 10.1016/j.rpth.2025.102984. eCollection 2025 Jul. Res Pract Thromb Haemost. 2025. PMID: 40837028 Free PMC article. Review.
References
-
- Eriksson N, Wadelius M. Prediction of warfarin dose: why, when and how? Pharmacogenomics. 2012;13:429‐440. - PubMed
-
- Badjatiya A, Rao SV. Advances in antiplatelet and anticoagulant therapies for NSTE‐ACS. Curr Cardiol Rep. 2019;21:3. - PubMed
-
- Patel S, Singh R, Preuss CV, Patel N. Warfarin. StatPearls. StatPearls Publishing; 2024. - PubMed
LinkOut - more resources
Full Text Sources
