. 2025 Jan 22;10(3):e10741.
doi: 10.1002/btm2.10741. eCollection 2025 May.

Establishment of a chemoresistant laryngeal cancer cell model to study chemoresistance and chemosensitization responses via transcriptomic analysis and a tumor-on-a-chip platform

Affiliations

Establishment of a chemoresistant laryngeal cancer cell model to study chemoresistance and chemosensitization responses via transcriptomic analysis and a tumor-on-a-chip platform

Christian R Moya-Garcia et al. Bioeng Transl Med. .

Abstract

Tumor resistance to chemotherapy is a common cause of cancer recurrence in patients with head and neck squamous cell carcinoma. The goal of this study is to establish and characterize a chemoresistant laryngeal cancer cell model and test its potential utility for chemosensitizing therapy. At the genotypic level, RNA sequencing confirmed that the cells acquired putative resistance with upregulated docetaxel-resistant (DR) genes (e.g., TUBB3, CYP24A1) and signaling pathways (e.g., PI3K/mTOR, autophagy). For phenotypic analysis, DR cells were co-cultured with laryngeal fibroblasts in a 2-channel microfluidic chip that mimics a hypoxic tumor core in vivo. A drug sensitivity test with a chemosensitizer, metformin (MTF), was performed on the laryngeal tumor-on-a-chip. Compared to non-treated controls, MTF-primed cancer cells exhibit higher sensitivity to docetaxel (DTX), that is, cell death. Collectively, this resistance-acquired cell model displayed presumed genotypic and phenotypic profiles of chemoresistance providing a viable option for testing new therapeutic strategies for restoring tumor sensitivity to DTX.

Keywords: chemoresistance; docetaxel; hypoxia; laryngeal cancer; metformin; senescence; transcriptomics; tumor‐on‐a‐chip.


Conflict of interest statement

The authors declare no conflict of interest.

Figures

FIGURE 1
FIGURE 1
Chemoresistance in laryngeal cancer cells with distinct genotypic profile. (a) Illustration of the protocol for inducing chemoresistance in laryngeal cancer cells. Brightfield images show the progression of chemoresistance and morphological changes in cancer colonies (4× magnification). (b) Chemoresistance can induce autophagy, apoptosis, cell migration, protein expression, gene expression and so on. (c) Drug resistance analysis of DTX cytotoxicity effect on non‐resistant (LSEC and LSCC) and resistant (DR‐LSCC) cells. (d) Autophagy staining of DR‐LSCC, LSCC, and LSEC with positive controls of tamoxifen. Blue = monodansylcadaverine. Scale bar = 20 μm. (e) Normalized autophagy absorbance to positive controls. Ordinary one‐way ANOVA, Bonferroni's multiple comparisons test as post hoc test (n = 9, ***p < 0.001, ****p < 0.0001). (f) Principal component analysis (PCA) of the transcriptomic data for each cell group sample (n = 5). (g) Total identified differentially expressed genes (DEG) are depicted as heat maps with a Z‐core (−2 to 2). Individual DEGs are represented on the y‐axis and the sample regions are along the x‐axis. (h) Number of upregulated and downregulated DEG (# DEG) of comparison between cell groups. (i) A volcano plot of LSEC vs. LSCC, and LSEC vs. DR‐LSCC comparisons. (j) Differentially expressed gene Venn diagram of comparison between cell groups. A linear model was used to obtain differentially expressed genes. For all genes and pathways, significance is defined as p‐adjusted <0.05. LSEC = laryngeal squamous epithelial cell; LSCC = laryngeal squamous cell carcinoma; DR‐LSCC = docetaxel‐resistant laryngeal squamous cell carcinoma.
FIGURE 2
FIGURE 2
HNC biomarker expression on analyzed laryngeal cells. (a) Heatmap of specific differences on HNC biomarkers, drug metabolism, oncogenes, and tumor suppressors with Z‐score (−1.5 to 1.5), *p < 0.05, § p < 0.01 in comparison to LSEC. (b) Relevant chemotherapy‐induced senescence between LSCC and DR‐LSCC with fold‐change (log2). The top 10 gene ontology molecular functions (GOMF) of (c) upregulated and (d) downregulated DEG in DR‐LSCC with ‐log10(p‐adj), in comparison to LSCC. Similarly, the top 10 genes biological process (GOBP) of (e) upregulated and (f) downregulated DEG in DR‐LSCC with ‐log10(p‐adj). A linear model was used to obtain differentially expressed genes. For all genes and pathways, significance is defined as p‐adjusted <0.05.
FIGURE 3
FIGURE 3
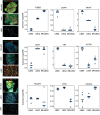
Immunostaining and corresponding transcriptomic data of chemoresistance markers. Immunofluorescence of βIII‐tubulin (TUBIII), EGFR, Ki‐67, E‐cadherin, vimentin, α‐smooth muscle actin (α‐SMA), Oct‐4, P53 and PI3K with their specific gene expression. Scale bar = 40 μm. Gene set enrichment analysis (GSEA) based on a pre‐ranked gene list by t‐statistic (n = 5, p < 0.05, § p < 0.01 in comparison to LSEC). A linear model was used to obtain differentially expressed genes.
FIGURE 4
FIGURE 4
mTOR, oxidative phosphorylation, and autophagy signaling pathways. (a) Genes of interest from mTOR pathway [hsa04150]. Blue = LSEC vs. DR‐LSCC; Red = LSCC vs. DR‐LSCC. (b, c) ELISA data of mTOR and MMP3 expressions of the cell groups LSEC, LSCC and DR‐LSCC. Two‐way ANOVA, Bonferroni's multiple comparisons test as post hoc test (n = 8, *p < 0.05, ****p < 0.0001). (d) KEGG oxidative phosphorylation pathway [hsa00190] on non‐resistant and resistant cells (LSEC vs. DR‐LSCC) with color of fold‐change (−4 to 4). Red = upregulation; Blue = downregulation. Genes of interest from KEGG oxidative phosphorylation pathway [hsa00190]. Blue = LSEC vs. DR‐LSCC; Red = LSCC vs. DR‐LSCC (f) Luminescent data on ATP/ADP ratio of LSEC, LSCC, and DR‐LSCC. Ordinary one‐way ANOVA, Bonferroni's multiple comparisons test as post hoc test (n = 8, *p < 0.05, ****p < 0.0001). (g) Genes of interest from KEGG autophagy pathway [hsa04140]. Blue = LSEC vs. DR‐LSCC; Red = LSCC vs. DR‐LSCC. A linear model was used to obtain differentially expressed genes. For all genes and pathways, significance is defined as p‐adjusted <0.05.
FIGURE 5
FIGURE 5
Effects of MTF alone and its combination with DTX on non‐resistant and resistant cells. (a) Dose response curve of the MTF dosage on non‐resistant cells and DR‐LSCC. Relative‐Absolute IC50 threshold expressed as vertical dotted lines. (b) Cytotoxic evaluation of MTF dosage via LIVE/DEAD staining. Green = live cells; Orange = dead cells. Scale bar = 30 μm. (c) Phospho‐mTOR levels after 1 mM metformin. Two‐way ANOVA, Bonferroni's multiple comparisons test as post hoc test (n = 9, *p < 0.05 compared to basal controls). (d) Autophagy activity after 1 mM metformin. Blue = autophagy activity; Red = dead cells. Scale bar = 10 μm. MTT analysis on cell viability after 3‐Day (e) and 3‐Day (f) treatment exposures. Two‐way ANOVA, Bonferroni's multiple comparisons test as post hoc test (n = 9, ***p < 0.001, ****p < 0.0001 compared to DR‐LSCC with combination therapy). (g) Cytotoxic evaluation of DTX alone, and MTF/DTX‐loaded chitosomes via LIVE/DEAD staining. Green = live cells; Orange = dead cells. Scale bar = 30 μm. (h) Genes associated with antioxidant, microtubule binding, and mucus glycosylation activities. Gene set enrichment analysis (GSEA) based on a pre‐ranked gene list by t‐statistic (n = 5, *p < 0.05). (i) KEGG analysis of DR‐LSCC upregulated genes compared to LSCC. (j) Schematic representation of DTX‐loaded chitosome internalization by cells. (k) Representative KEGG endocytosis pathway [hsa05200] LSCC vs. DR‐LSCC, with genes of interest PIP5K1A, E3 ligase/UBR3, FOLR1, CAV1/caveolin (pointed at with magenta arrows) with color of fold‐change (−4 to 4). Red = upregulation; Blue = downregulation. A linear model was used to obtain differentially expressed genes. For all genes and pathways, significance is defined as p‐adjusted <0.05.
FIGURE 6
FIGURE 6
Hypoxia and migration analyses within the microfluidic device. (a) CAD design of the BEOnChip Gradient device. DR‐LSCC were seeded on mucin‐coated cancer channels, whereas HVFF embedded in a collagen I gel were placed in a Stromal chamber. (b) Phenotypic markers of the co‐culture at Day 0. DR‐LSCC (green/TUBIII+, red/Vimentin) and HVFF (green/TUBIII, red/Vimentin+). Magenta line = Collagen I gel limit. (c) Schematic representation of the co‐culture setup within the microfluidic device mimicking the hypoxic tumor core by blocking inlets/outlets (represented as ×) after cell seeding to create an oxygen/nutrient gradient flow. (d) Migration analysis of the stromal cells (red, vimentin) toward the cancer channel (green, TUBIII), scale bar = 20 μm. Controls of Deferoxamine as hypoxia inducer and MTF as proliferation inhibitor (e) Hypoxia and oxidative stress analyses on DR‐LSCC and HVFF at 24 h (Day 0). Orange = hypoxia; Green = oxidative stress. Positive controls: Deferoxamine as hypoxia inducer and Pyocyanin as oxidative stress inducer.
FIGURE 7
FIGURE 7
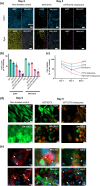
MTF/DTX combination therapy tested on the tumor‐on‐a‐chip. (a) Cytotoxic effect via DAPI inspection, and Spot detection algorithm at Day 5. Yellow spots = HVFF; Gray spots = DR‐LSCC; Magenta line = collagen gel limit. Scale bar = 100 μm. (b) Cell count using Spot detection algorithm on DAPI images at 5‐day inspection. Two‐way ANOVA, Bonferroni's multiple comparisons test (n = 9, *p < 0.05 compared to respective cell groups with combination therapy). (c) LDH co‐culture supernatant analysis. One‐way ANOVA and Bonferroni's multiple comparisons as post hoc test (n = 9, *p < 0.05). (d) LIVE/DEAD images on Day 5. Green = live cells; Orange = dead cells. Scale bar = 20 μm. (e) Fluorescent chitosome uptake. Immunostaining of HVFF (red/EGFR+, green/CK5) and cancer (red/EGFR+, green/CK5+) cells showed the internalization of the orange‐fluorescent chitosomes (pointed at with white arrows) with DAPI as counterstaining after 6 h inspection. Cancer‐associated fibroblast behavior characterized by EGFR expression could have been activated by DR‐LSCC/HVFF crosstalk (cytokine pathway)., Scale bars = 2 μm (top images), 10 μm (below images).

Similar articles

References

    1. Patterson RH, Fischman VG, Wasserman I, et al. Global burden of head and neck cancer: economic consequences, health, and the role of surgery. Otolaryngol – Head Neck Surg (United States). 2020;162(3):296‐303. doi:10.1177/0194599819897265 - DOI - PubMed
    1. Moya‐Garcia CR, Okuyama H, Sadeghi N, Li J, Tabrizian M, Li‐Jessen NYK. In vitro models for head and neck cancer : current status and future perspective. Front Oncol. 2022;12:3691. doi:10.3389/fonc.2022.960340 - DOI - PMC - PubMed
    1. Schutte HW, Heutink F, Wellenstein DJ, et al. Impact of time to diagnosis and treatment in head and neck cancer: a systematic review. Otolaryngol – Head Neck Surg (United States). 2020;162(4):446‐457. doi:10.1177/0194599820906387 - DOI - PubMed
    1. Gulati S, Desai J, Palackdharry SM, et al. Phase 1 dose‐finding study of metformin in combination with concurrent cisplatin and radiotherapy in patients with locally advanced head and neck squamous cell cancer. Cancer. 2020;126(2):354‐362. doi:10.1002/cncr.32539 - DOI - PMC - PubMed
    1. Schepens EJA, Al‐Mamgani A, Karssemakers LHE, van den Broek D, van den Brekel MWM, Lopez‐Yurda M. Squamous cell carcinoma antigen in the follow‐up of patients with head and neck cancer. Otolaryngol – Head Neck Surg (United States). 2023;170:422‐430. doi:10.1002/ohn.510 - DOI - PubMed

LinkOut - more resources