

CEP55 as a prognostic indicator and a predictive marker in oral squamous cell carcinoma
- PMID: 40386043
- PMCID: PMC12080573
- DOI: 10.7150/ijms.107996
CEP55 as a prognostic indicator and a predictive marker in oral squamous cell carcinoma
Abstract
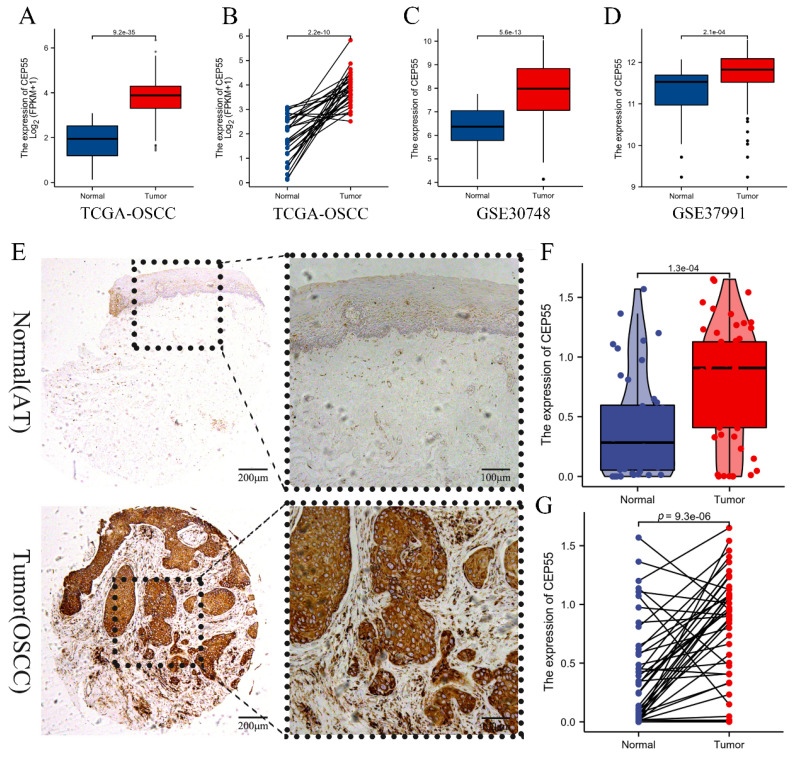
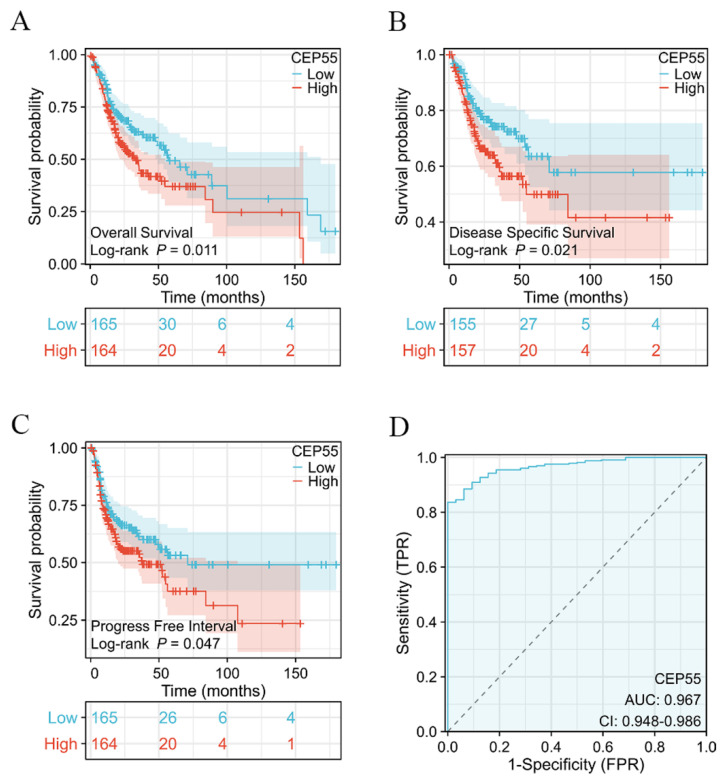
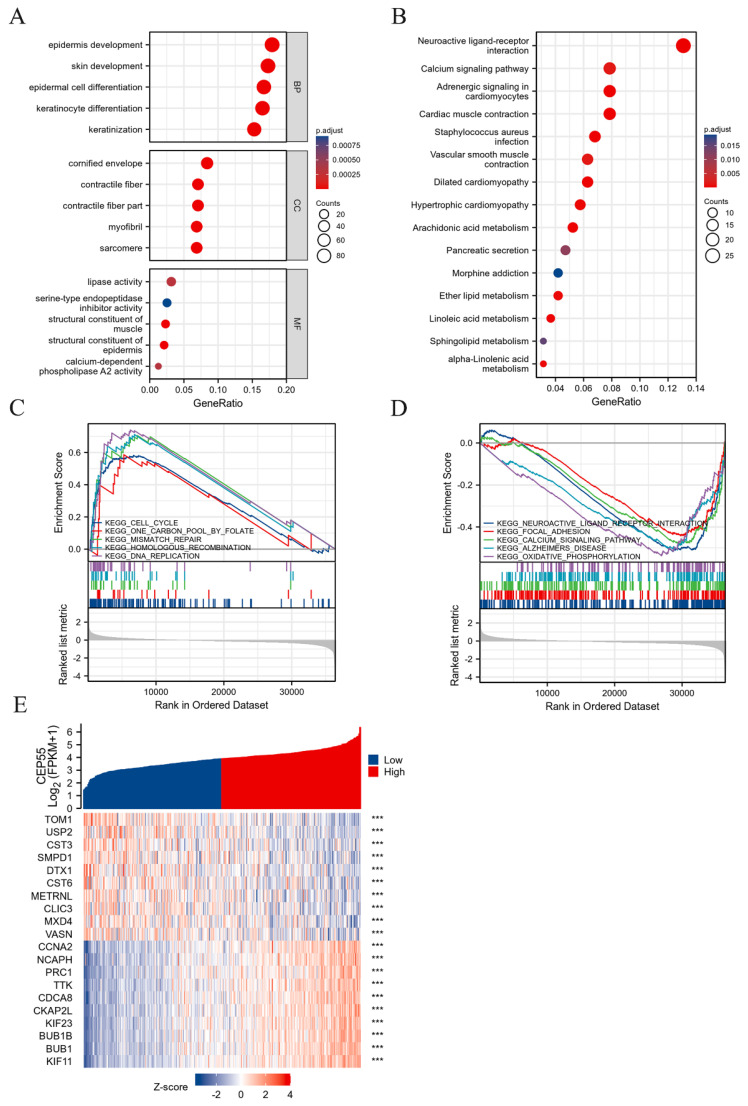
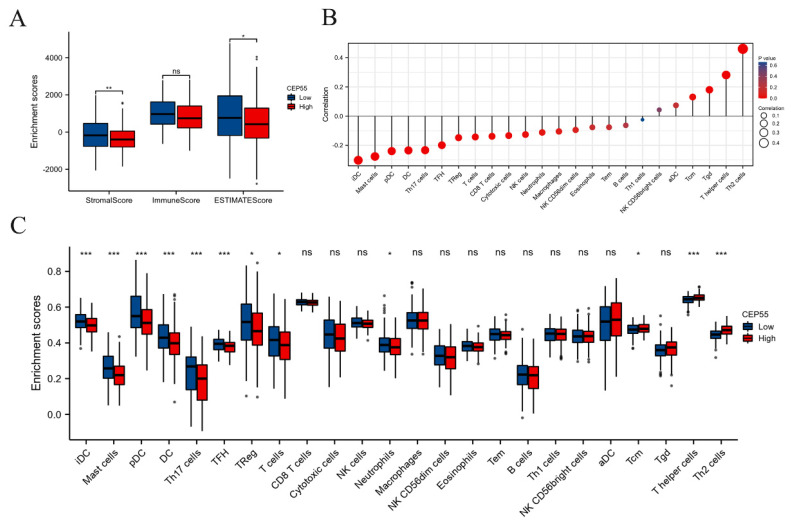
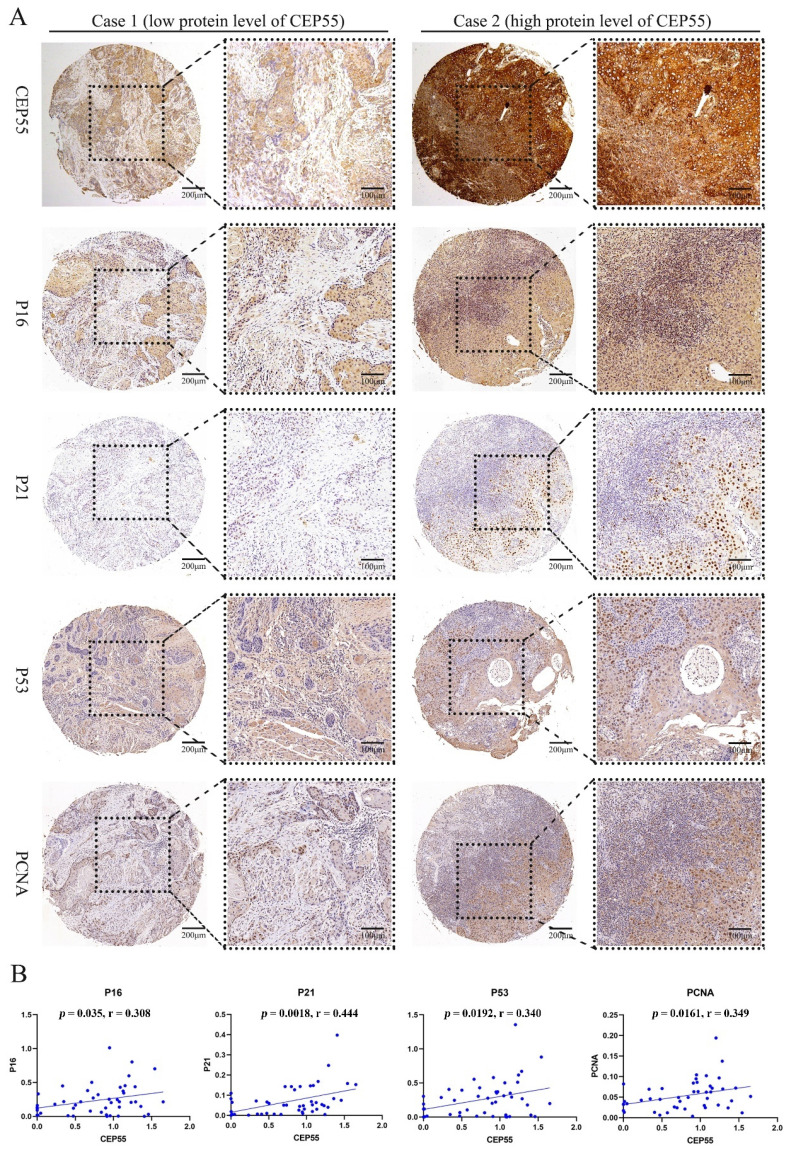
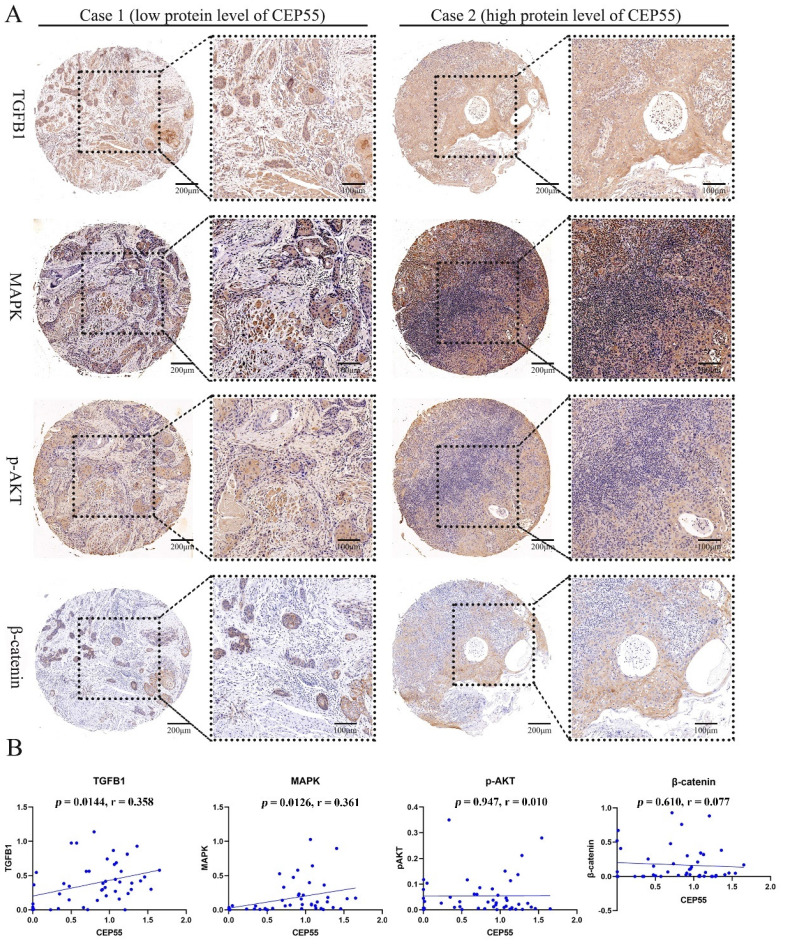
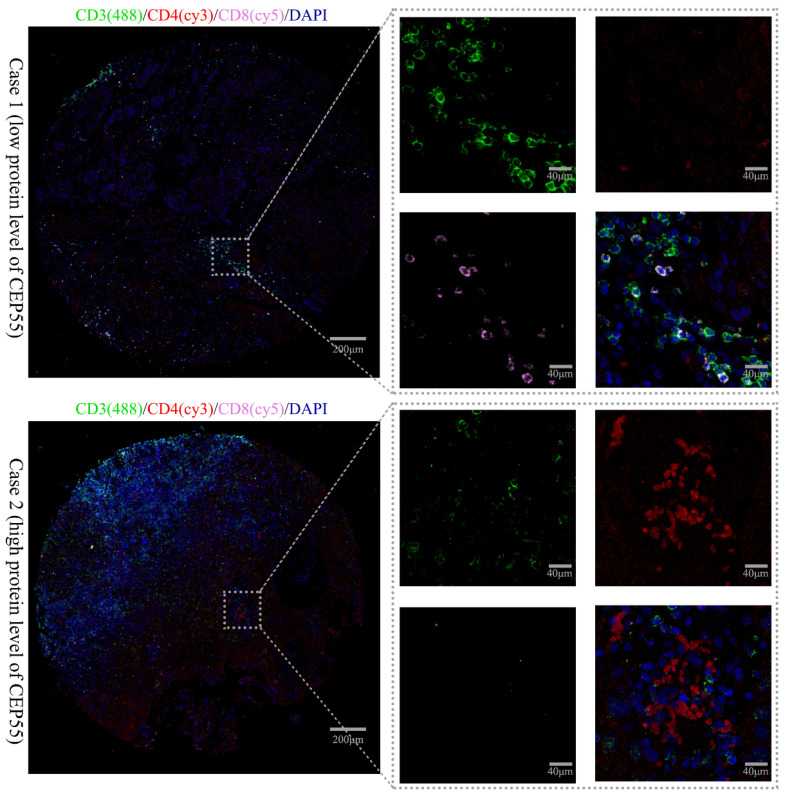
Objective: To investigate the role of CEP55 in the occurrence and development of oral squamous cell carcinoma (OSCC). Materials and Methods: Through the utilization of the online OSCC database and bioinformatic analysis, we examine CEP55 expression and its correlation with prognosis, pathways, and immune infiltration. CEP55 and other biomarkers were stained using immunohistochemical methods in 57 cases of OSCC and 44 cases of adjacent paired tissues, demonstrating the clear involvement of CEP55. Results: The expression levels of CEP55 were significantly higher in OSCC tissues compared to normal tissues. Additionally, higher levels of CEP55 were associated with a worse prognosis. CEP55 expression levels were significantly higher in OSCC tissues compared to normal tissues. Additionally, higher levels of CEP55 were associated with a worse prognosis. GSEA results indicated a correlation between CEP55 and the cell cycle. Immunohistochemical staining revealed a significant positive correlation between CEP55 and cell cycle-related protein markers (PCNA, P16, P21, and P53). Furthermore, CEP55 was found to significantly inhibit tumor immune infiltration. As a result, CEP55 expression decreased infiltration of 9 types of immune cells (iDC, mast cells, pDC, DC, Th17 cells, TFH, Treg, T cells, and neutrophils), while increasing infiltration of only 3 types of immune cells (Tcm, T Helper cells, and Th2 cells). Conclusion: The results suggest that CEP55 plays a crucial role in the progression of OSCC promoting cell cycle progression and suppressing immune infiltration.
Keywords: CEP55; OSCC; cell cycle; immune infiltration; prognosis.
© The author(s).
Conflict of interest statement
Competing Interests: The authors have declared that no competing interest exists.
Figures
Similar articles
-
Parathyroid hormone-related protein serves as a prognostic indicator in oral squamous cell carcinoma.J Exp Clin Cancer Res. 2014 Dec 18;33(1):100. doi: 10.1186/s13046-014-0100-y. J Exp Clin Cancer Res. 2014. PMID: 25539663 Free PMC article.
-
Lectin-like Transcript-1 (LLT1) Expression in Oral Squamous Cell Carcinomas: Prognostic Significance and Relationship with the Tumor Immune Microenvironment.Int J Mol Sci. 2024 Apr 13;25(8):4314. doi: 10.3390/ijms25084314. Int J Mol Sci. 2024. PMID: 38673902 Free PMC article.
-
Guanylate binding protein 5 is an immune-related biomarker of oral squamous cell carcinoma: A retrospective prognostic study with bioinformatic analysis.Cancer Med. 2024 Jul;13(13):e7431. doi: 10.1002/cam4.7431. Cancer Med. 2024. PMID: 38978333 Free PMC article.
-
Identification of a novel necroptosis-related LncRNA signature for prognostic prediction and immune response in oral squamous cell carcinoma.Cancer Biomark. 2024;40(3-4):319-342. doi: 10.3233/CBM-230407. Cancer Biomark. 2024. PMID: 39213052 Free PMC article.
-
TOM40 as a prognostic oncogene for oral squamous cell carcinoma prognosis.BMC Cancer. 2025 Jan 15;25(1):92. doi: 10.1186/s12885-024-13417-w. BMC Cancer. 2025. PMID: 39815211 Free PMC article.
References
-
- Wu XB, Wang RY, Gong ZJ, Yu J, Zhu SR. [The expression and significance of heparanase in oral squamous cell carcinoma with different metastatic potentials] Zhonghua Yi Xue Za Zhi. 2016;96:3047–52. - PubMed
MeSH terms
Substances
LinkOut - more resources
Full Text Sources
Medical
Research Materials
Miscellaneous
