

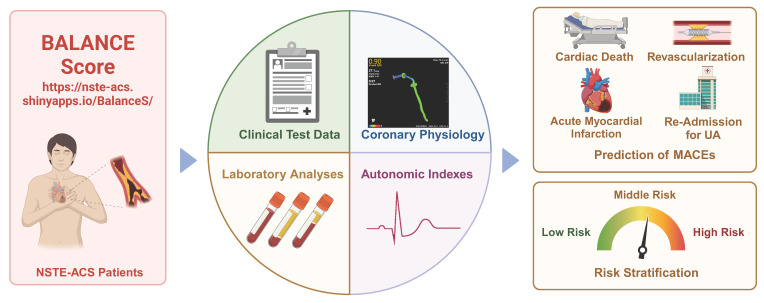
An Easy-to-Use Risk Stratification System for NSTE-ACS Patients Combining Autonomic Nervous System and Coronary Physiology
- PMID: 40386048
- PMCID: PMC12080570
- DOI: 10.7150/ijms.111214
An Easy-to-Use Risk Stratification System for NSTE-ACS Patients Combining Autonomic Nervous System and Coronary Physiology
Abstract
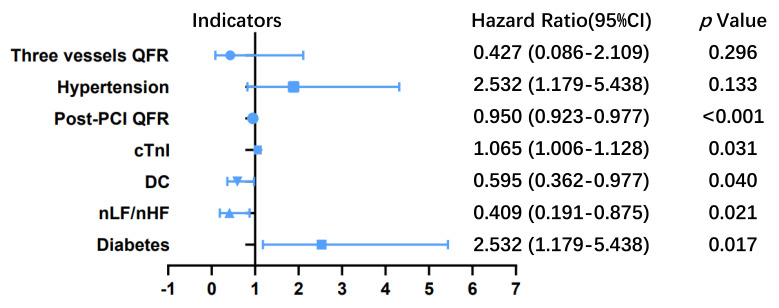
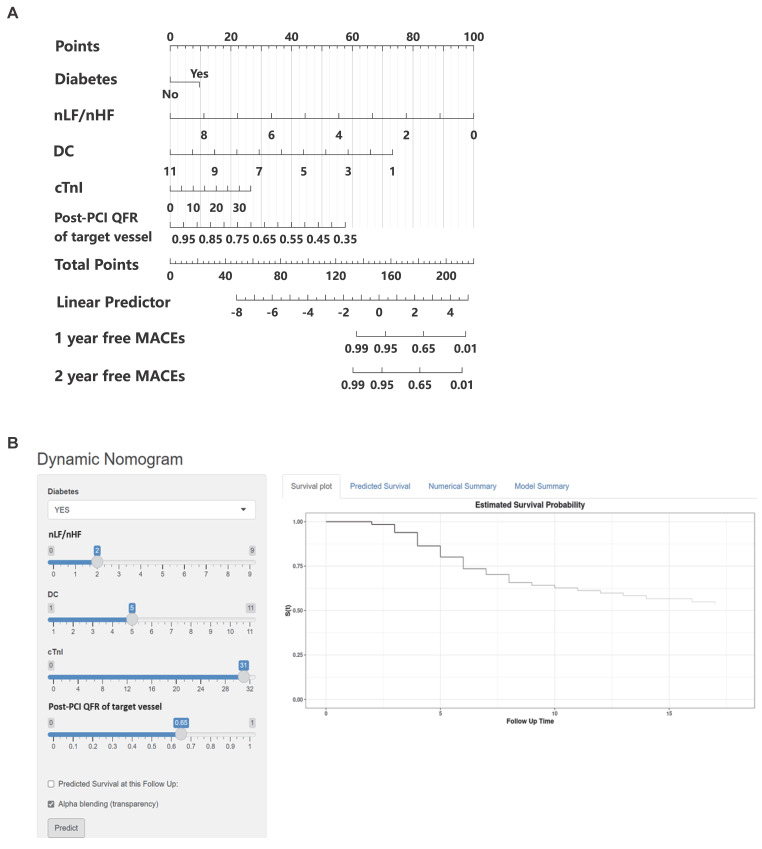
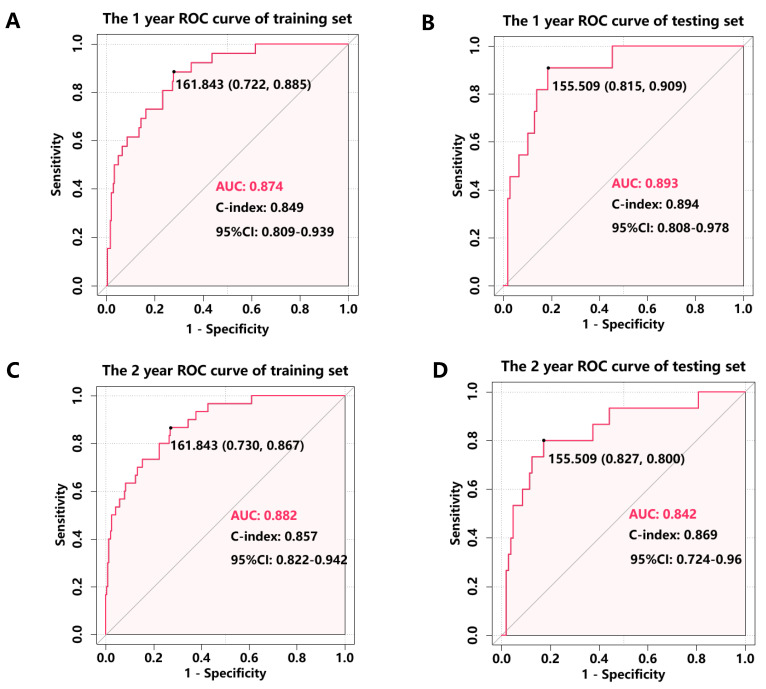
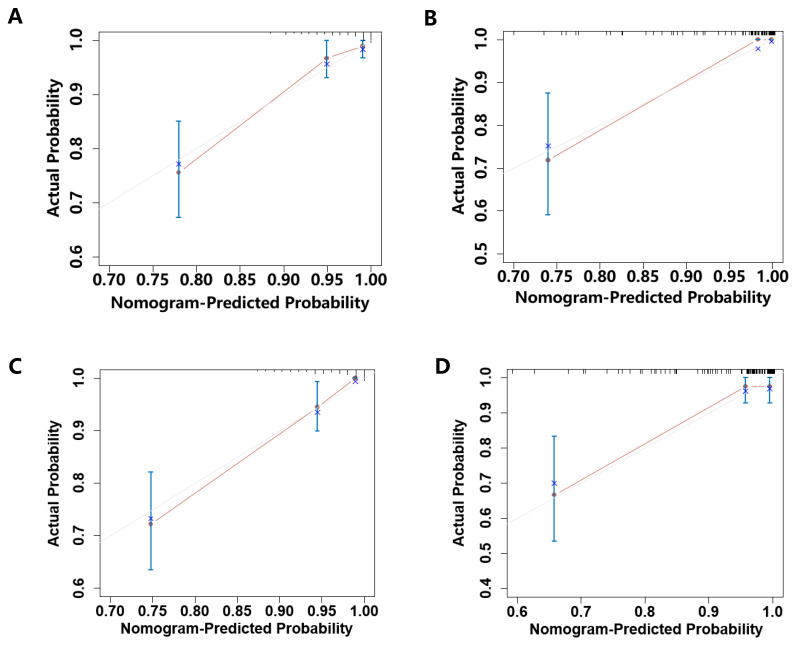
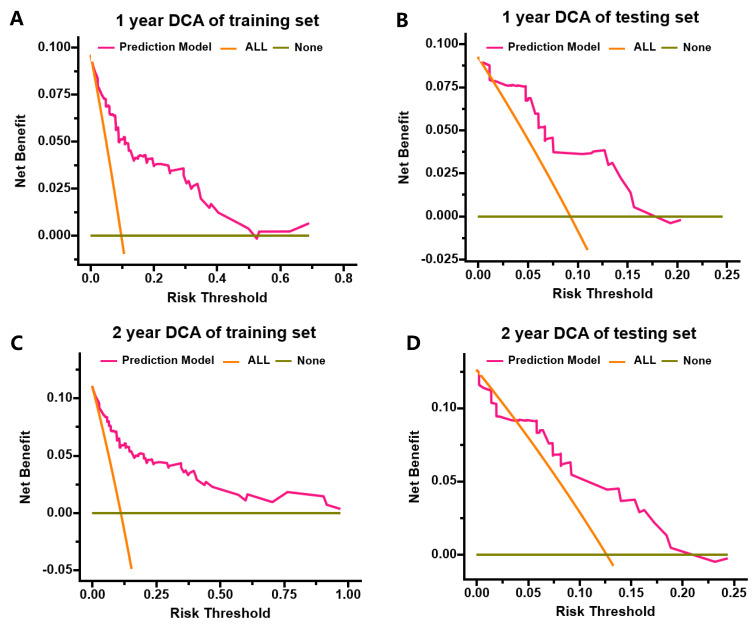
Background: The evaluation of autonomic nervous system (ANS) function and coronary physiology through quantitative flow ratio (QFR) analysis provides a precise method for assessing the severity and prognosis of acute coronary syndrome (ACS). Aims: This study aimed to develop and validate a risk score model for predicting the long-term prognosis of non-ST-elevation ACS (NSTE-ACS) patients who underwent complete and successful percutaneous coronary intervention (PCI). Methods: NSTE-ACS patients who underwent complete and successful PCI with preoperative and postoperative QFR measurements between January 2018 and December 2020 in our medical center were included. 24-hour Holter monitoring was performed to assess deceleration capacity (DC) and heart rate variability (HRV) parameters. The primary endpoint was the occurrence of major adverse cardiac events (MACEs). Results: The training cohort consisted of 271 patients, while the testing cohort consisted of 119 patients. The nomogram considered diabetes, normalized low-frequency (nLF) power/normalized high-frequency (nHF) power, DC, cardiac troponin I (cTnI), post-PCI QFR of the target vessel. The model demonstrated excellent discriminative ability, with area under the curve (AUC) values of 0.874 (95% CI: 0.809-0.939) for 1-year MACE prediction in the training cohort and 0.893 (95% CI: 0.808-0.978) in the testing cohort. For 2-year MACE prediction, the AUC values were 0.882 (95% CI: 0.822-0.942) and 0.842 (95% CI: 0.724-0.960) in the training and testing cohorts. Conclusions: We successfully developed and validated a risk stratification system that integrates baseline clinical characteristics (diabetes, cTnI levels), ANS parameters (nLF/nHF ratio, DC), and coronary physiological assessment (post-PCI QFR). This model effectively predicts MACEs in NSTE-ACS patients following PCI, providing valuable prognostic information for clinical decision-making.
Keywords: autonomic nervous system; major adverse cardiac events; non-st-elevation ACS; quantitative flow ratio; risk stratification system.
© The author(s).
Conflict of interest statement
Competing Interests: The authors have declared that no competing interest exists.
Figures
References
-
- Lawton JS, Tamis-Holland JE, Bangalore S, Bates ER, Beckie TM, Bischoff JM. et al. 2021 ACC/AHA/SCAI Guideline for Coronary Artery Revascularization: Executive Summary: A Report of the American College of Cardiology/American Heart Association Joint Committee on Clinical Practice Guidelines. Circulation. 2022;145:e4–e17. - PubMed
-
- Lee SH, Hong D, Shin D, Kim HK, Park KH, Choo EH. et al. QFR Assessment and Prognosis After Nonculprit PCI in Patients With Acute Myocardial Infarction. JACC Cardiovasc Interv. 2023;16:2365–79. - PubMed
-
- Antman EM, Cohen M, Bernink PJ, McCabe CH, Horacek T, Papuchis G. et al. The TIMI risk score for unstable angina/non-ST elevation MI: A method for prognostication and therapeutic decision making. Jama. 2000;284:835–42. - PubMed
-
- Nicholls M. Optimizing Cardiovascular Risk Factors. Eur Heart J. 2021;42:3420–1. - PubMed
-
- Song L, Xu B, Tu S, Guan C, Jin Z, Yu B. et al. 2-Year Outcomes of Angiographic Quantitative Flow Ratio-Guided Coronary Interventions. J Am Coll Cardiol. 2022;80:2089–101. - PubMed
MeSH terms
LinkOut - more resources
Full Text Sources
Research Materials
Miscellaneous
