. 2025 May 7;22(10):2518-2532.
doi: 10.7150/ijms.102700. eCollection 2025.

Endothelial TIE2 Mutation Induced Contraction Deficiency of Vascular Smooth Muscle Cells via Phenotypic Transition Regulation in Venous Malformations

Affiliations

Endothelial TIE2 Mutation Induced Contraction Deficiency of Vascular Smooth Muscle Cells via Phenotypic Transition Regulation in Venous Malformations

Zhong Du et al. Int J Med Sci. .

Abstract

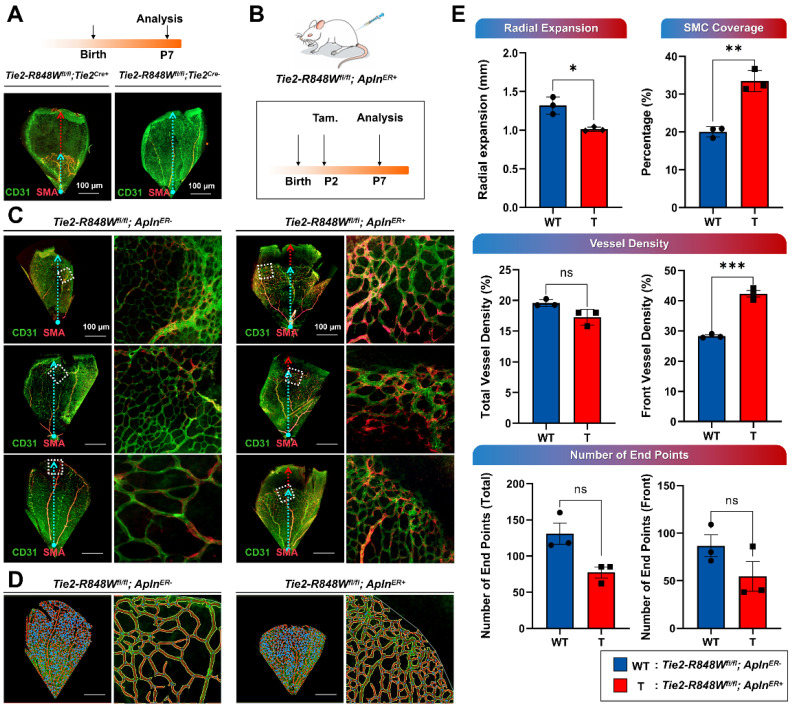
Introduction: Venous malformations (VMs) are congenital vascular malformations characterized by venous cavity enlargement and malformation. Although TIE2 mutation is a recognized genetic landscape in VMs, the regulatory role of TIE2 in vascular smooth muscle cell (VSMC) contraction remains unclear. Materials and Methods: We generated Tie2-R848Wfl/fl;Tie2Cre+ and Tie2-R848Wfl/fl;AplnER+ mice through specific expression of Tie2-R848W, a typical mutation in inherited VM, in endothelial cells (ECs). Histological and transcriptome sequencing analyses were performed on vascular abnormalities in the mutant mouse model. Postnatal vascular development in vivo was studied through morphometric analysis of the retinal vasculature. Under in vitro coculture conditions, the functional abnormality of VSMCs was studied using transwell analysis, proliferation analysis, a cell contraction assay and transcriptome sequencing analysis. Markers related to the VSMC phenotypic transition were analyzed via western blotting and quantitative RT‑PCR. Results: Tie2-R848Wfl/fl;Tie2Cre+ mice developed spontaneous pulmonary vascular malformations displaying internal hemorrhage and increased vasculature with α-SMA+ enveloped VSMCs. In Tie2-R848Wfl/fl;AplnER+ mice, Tie2-R848W mutation also induced postnatal retinal vascular malformations (higher vascular density and coverage of α-SMA+ VSMCs). According to phenotypes and molecular markers (Acta2, Cnn1, Sm22a and Opn), dysregulated phenotypic transition of VSMCs might be the pathogenic basis. Under in vitro coculture condition, the decreased contractile ability of synthetic VSMCs was significant in the mutant group, while downregulated ion transmembrane transport and TNFSF10 may play substantial roles in initiating this process. Conclusion: Endothelial TIE2 mutation might induce an abnormal EC-VSMC regulatory relationship strongly associated with phenotypic transition of VSMCs. Weakened contractility and abnormal proliferation induce chronic cavity expansion and thickening of the muscle layer, which may be potential mechanism basis of VMs.

Keywords: Endothelial cell; Mouse model; Mutation; Phenotypic transition; TIE2; Vascular smooth muscle cell.; Venous malformations.


Conflict of interest statement

Competing Interests: The authors have declared that no competing interest exists.

Figures

Figure 1
Figure 1
Tie2-R848Wfl/fl;Tie2Cre+ mice developed pulmonary vascular malformations with internal hemorrhage. (A) High Cre-inducible efficiency (red) in the lungs was apparent for either the embryonic period (E18.5) or the immature period (W4). Bar=100 μm. (B) Via the CRISPR/Cas9 genetic editing approach and based on a Cre/loxP recombination design, an inducible knock-in mouse model, Tie2-R848Wfl/fl transgenic mice, was generated. WT (top), targeted inducible Tie2-R848W locus (middle), and Cre-loxP-mediated deletion of exons 15-23 encoding the wild-type domain of Tie2 (bottom). Red triangles, loxP sites. Pink rectangle, mutant exon 15. (C) Compared to no mice in the control group (0/11), 73.3% (11/15) of Tie2-R848Wfl/fl;Tie2Cre+ mice exhibited regional red spots in the lung lobes. (D) Regional red spots (surrounded by black dotted line) in the lung lobes could be observed at W4 and W12. Bar=1 cm. (E) Immunohistochemical analysis for lung defects (CD34, ERG and VEGFA) confirmed numerous internal hemorrhages in a no-boundary region without obvious lymphatic cell infiltration, the distribution of vascular ECs, and an enlarged alveolar space filled with erythrocytes. Bar=100 μm. (F) In the hemorrhage region, a greater amount of vasculature (indicated by white arrow) with discontinuous α-SMA+ enveloped VSMCs was detected via immunofluorescence colocalization analysis for CD31 (green) and α-SMA (orange). B, bronchus. Bar=500 μm. The vascular density (vascular number/mm2) was quantified in lung tissues by analyzing equivalent regions from both the control and mutant groups. *P<0.05.
Figure 2
Figure 2
Endothelial cell-specific Tie2-R848W induced postnatal retinal vascular malformations. (A) Reduced retinal vascular outgrowth was identified in Tie2-R848Wfl/fl;Tie2Cre+ mice at P7 via immunofluorescence colocalization analysis for CD31 (green) and α-SMA (orange). Blue dashed arrow, radial expansion of the retinal vasculature from the outer front edge of the vascular network to the center of the optic axis. Red dashed arrow, distance between the retinal vasculature margin and retinal margin (reduced retinal vascular outgrowth). Bar=100 μm. (B) Schematic of tamoxifen (Tam.) administration and analysis in the Tie2-R848Wfl/fl;AplnER+ mice for postnatal retinal vascular analysis (P7). (C) Immunofluorescence colocalization analysis of CD31 (green) and α-SMA (orange) in the postnatal retinal vasculature (P7) in Tie2-R848Wfl/fl;AplnER+ mice. Blue dashed arrow, radial expansion of the retinal vasculature from the outer front edge of the vascular network to the center of the optic axis. Red dashed arrow, distance between the retinal vasculature margin and retinal margin (reduced retinal vascular outgrowth). Square region surrounded by white dotted line, typical retinal vascular growth front region. Bar=100 μm. (D) Microvascular plexuses at retinal locations spanning the whole region and growth front region were modeled digitally in Tie2-R848Wfl/fl;AplnER+ mice with AngioTool software. Blue spot, junction point of vascular branches. Yellow line, outline of the vasculature. Red line, skeleton and direction of the vasculature. Bar=100 μm. (E) According to modeling analysis, in the Tie2-R848Wfl/fl;AplnER+ mouse group, the radial expansion distance was significantly decreased, while the coverage rate of α-SMA+ VSMCs was significantly increased. Although total vascular density was not significantly different from that in the control group, the vascular density of the developmental frontier area in mutant mice was significantly increased. Although the number of neovascular buds (the number of end points) was slightly decreased in the mutant group, no significant difference was found. *P<0.05, **P<0.001, ***P<0.0001, ns, not significant.
Figure 3
Figure 3
Transcriptomic analyses of pulmonary vascular developmental defect in Tie2-R848Wfl/fl;Tie2Cre+ mice. (A) Heatmap of differentially expressed genes in pulmonary vascular developmental defects from Tie2-R848Wfl/fl;Tie2Cre+ mice versus normal lung tissue from control mice. Each column represents an individual replicate, and each row represents an individual gene. Upregulated genes are shown in red, and downregulated genes are displayed in blue. n=4 mice for the pulmonary vascular developmental defect group, n=3 mice for the control group. Differentially expressed genes were defined as genes with a Benjamini‒Hochberg-adjusted P<0.05 and |log2FoldChange|>1. (B) Volcano plots of gene expression changes in pulmonary vascular developmental defects versus normal lung tissue from control mice. Green dots indicate downregulated genes. Red dots indicate upregulated genes. P<0.05 and |log2FoldChange|>1. P values were determined by the limma package. n=4 mice for the pulmonary vascular developmental defect group, n=3 mice for the control group. (C) KEGG pathway classifications of differentially downregulated genes. (D) Top 10 GO terms related to biological processes for significantly downregulated genes. (E) Top 18 KEGG pathways of differentially downregulated genes. (F) Heatmap of genes with the most obvious downregulation and genes related to phenotypic transition of VSMCs. Each column represents an individual replicate, and each row represents an individual gene. Upregulated genes are shown in red, and downregulated genes are displayed in blue. n=4 mice for the pulmonary vascular developmental defect group, n=3 mice for the control group.
Figure 4
Figure 4
HUVECs carrying TIE2-R849W demonstrated the phenotypic transition of HUVSMCs. (A) The protein expression level and phosphorylation state of nontransfected HUVECs (CON group) and HUVECs transfected with TIE2-R849W (TIE2-R849W group) probed with the indicated antibodies (TIE2, p-TIE2, and ACTIN). (B) TIE2 mutation did not obviously affect the proliferation ability of nontransfected HUVECs (CON) and HUVECs transfected with TIE2-R849W (TIE2-R849W). The data are expressed as the mean±SEM. ns, not significant. (C) TIE2 mutation did not obviously affect the recruitment of VSMCs under the HUVEC-HUVSMC coculture conditions (6 h, 12 h and 24 h). Compared with that in the control group, the protein expression of SMA, SM22A and OPN was altered (D); proliferation ability was increased (E); and contractile ability was reduced (F) for HUVSMCs that were cultured with conditioned medium from HUVECs transfected with TIE2-R849W (TIE2-R849W). Bar=2 cm. The data are expressed as the mean±SEM. *P<0.05, **P<0.001, ***P<0.0001, ns, not significant.
Figure 5
Figure 5
Downregulated ion transmembrane transport might be deeply involved in initiating the phenotypic transition process in VSMCs. (A) Heatmap of differentially expressed genes in VSMCs cocultured with conditioned medium from control or mutant HUVECs in advance for 48 hours. Each column represents an individual replicate, and each row represents an individual gene. Upregulated genes are shown in red, and downregulated genes are displayed in blue. Differentially expressed genes were defined as genes with a Benjamini‒Hochberg-adjusted P<0.05 and |log2FoldChange|>1. (B) Volcano plots of gene expression changes in VSMCs cocultured with conditioned medium from control or mutant HUVECs in advance for 48 hours. Green dots indicate downregulated genes. Blue red dots indicate upregulated genes. P<0.05 and |log2FoldChange|>1. The P values were determined by the limma package. (C) Top 10 KEGG pathways of differentially downregulated genes. (D) Heatmap of genes with the most obvious downregulation and genes related to phenotypic transition of VSMCs. Each column represents an individual replicate, and each row represents an individual gene. Upregulated genes are shown in red, and downregulated genes are displayed in blue. Validation of the mRNA expression pattern of genes related to the phenotypic transition of VSMCs (ACTA2, CNN1, OPN and TAGLN) (E) and downregulated genes closely related to ion transmembrane transport (KCNA1, KCNMA1, KCNB2, KCNJ5, KCNJ6, KCNJ9 and KCNQ5) (F). *P<0.05, **P<0.001, ***P<0.0001, ns, not significant. (G) Schematic diagrams depicting that germline/somatic TIE2 mutation in ECs might induce an abnormal regulatory relationship between ECs and VSMCs that is closely associated with the phenotypic transition of VSMCs. Abnormal contractility and proliferation due to increased synthetic VSMCs induce chronic expansion of the cavity and thickening of the muscle layer. The mechanical pressure on the wall and a hypoxic environment might also stimulate the synthesis transition and eventually result in VMs.

Similar articles

References

    1. Greene AK, Goss JA. Vascular Anomalies: From a Clinicohistologic to a Genetic Framework. Plastic and reconstructive surgery. 2018;141:709e–17e. - PMC - PubMed
    1. Du Z, Liu JL, You YH, Wang LZ, He J, Zheng JW. et al. Genetic landscape of common venous malformations in the head and neck. Journal of vascular surgery Venous and lymphatic disorders. 2021;9:1007–16. e7. - PubMed
    1. Du Z, Zheng J, Zhang Z, Wang Y. Review of the endothelial pathogenic mechanism of TIE2-related venous malformation. Journal of vascular surgery Venous and lymphatic disorders. 2017;5:740–8. - PubMed
    1. Shu W, Lin Y, Hua R, Luo Y, He N, Fang L. et al. Cutaneomucosal venous malformations are linked to the TIE2 mutation in a large Chinese family. Experimental dermatology. 2012;21:456–7. - PubMed
    1. Limaye N, Wouters V, Uebelhoer M, Tuominen M, Wirkkala R, Mulliken JB. et al. Somatic mutations in angiopoietin receptor gene TEK cause solitary and multiple sporadic venous malformations. Nature genetics. 2009;41:118–24. - PMC - PubMed

MeSH terms