. 2025 Apr 28;22(10):2470-2487.
doi: 10.7150/ijms.112735. eCollection 2025.

Exploring Renin-angiotensin System Genes as Novel Prognostic Biomarkers for Oral Squamous Cell Carcinoma

Affiliations

Exploring Renin-angiotensin System Genes as Novel Prognostic Biomarkers for Oral Squamous Cell Carcinoma

Zhengzheng Wu et al. Int J Med Sci. .

Abstract

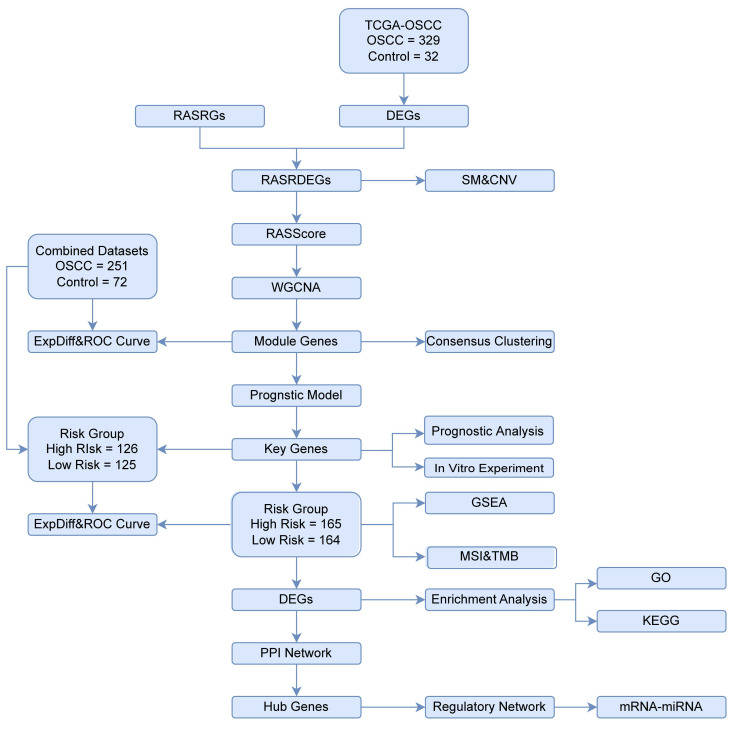
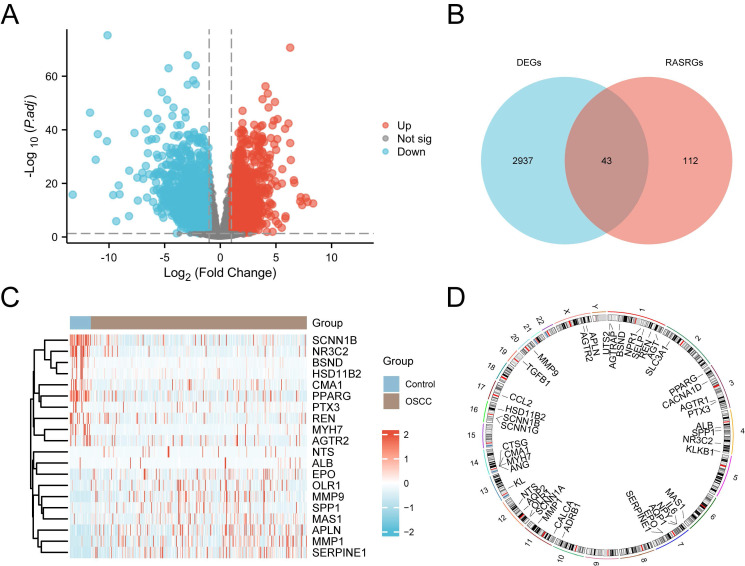
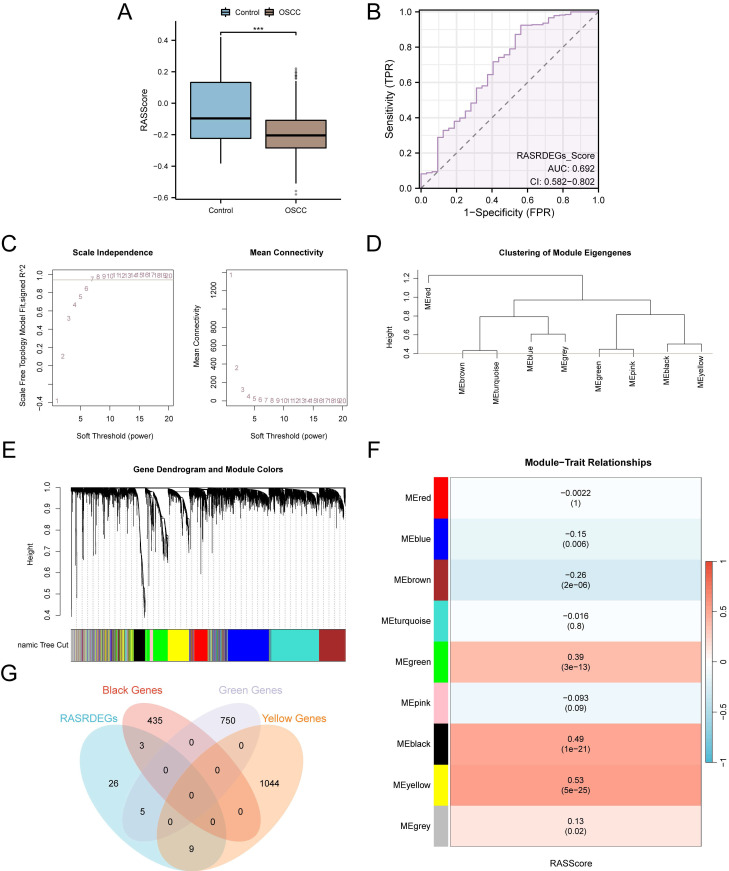
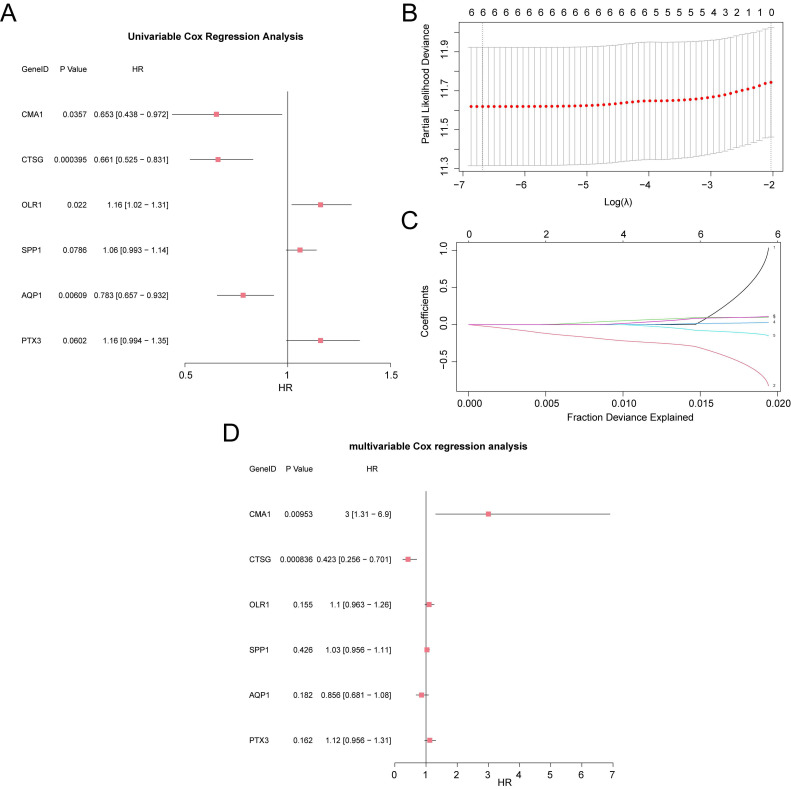
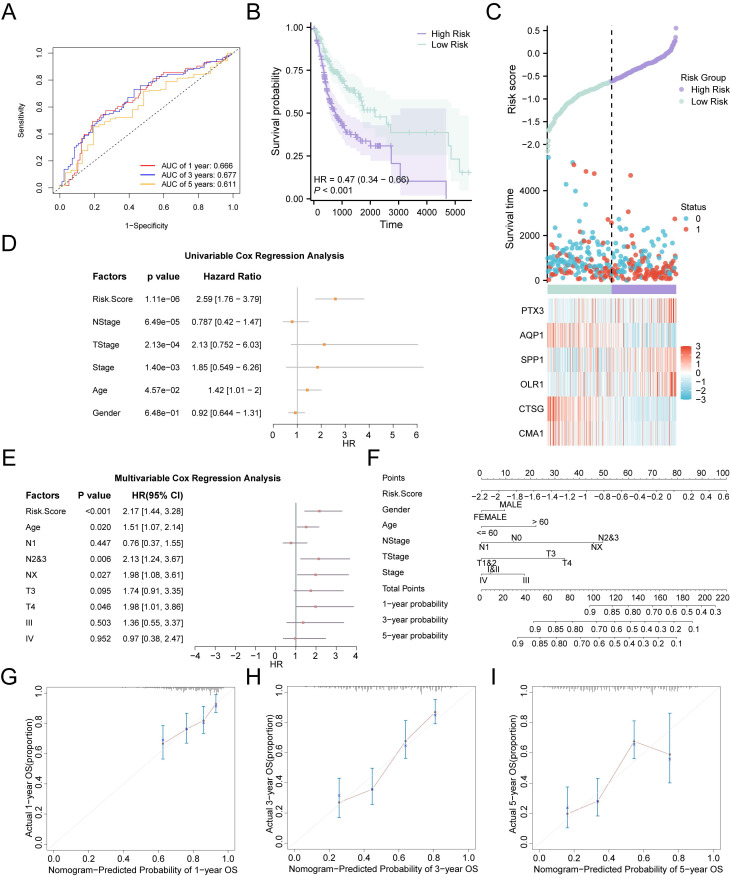
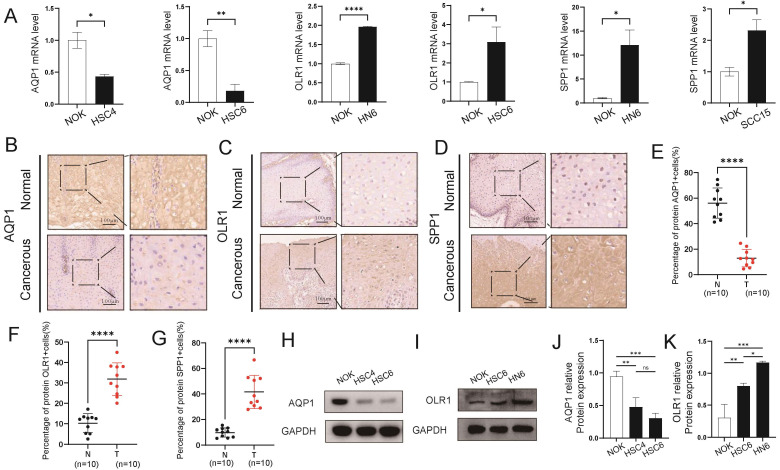
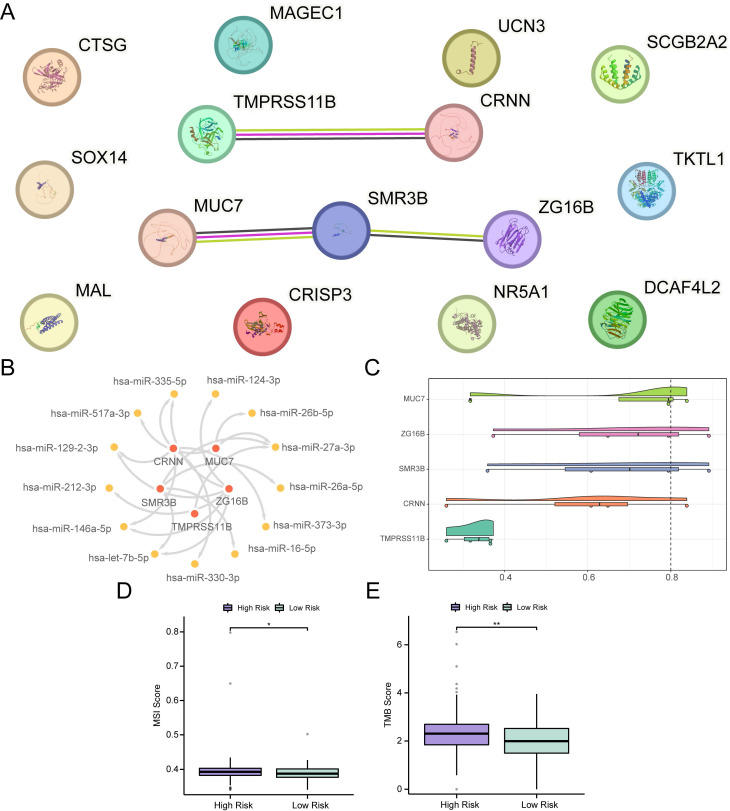
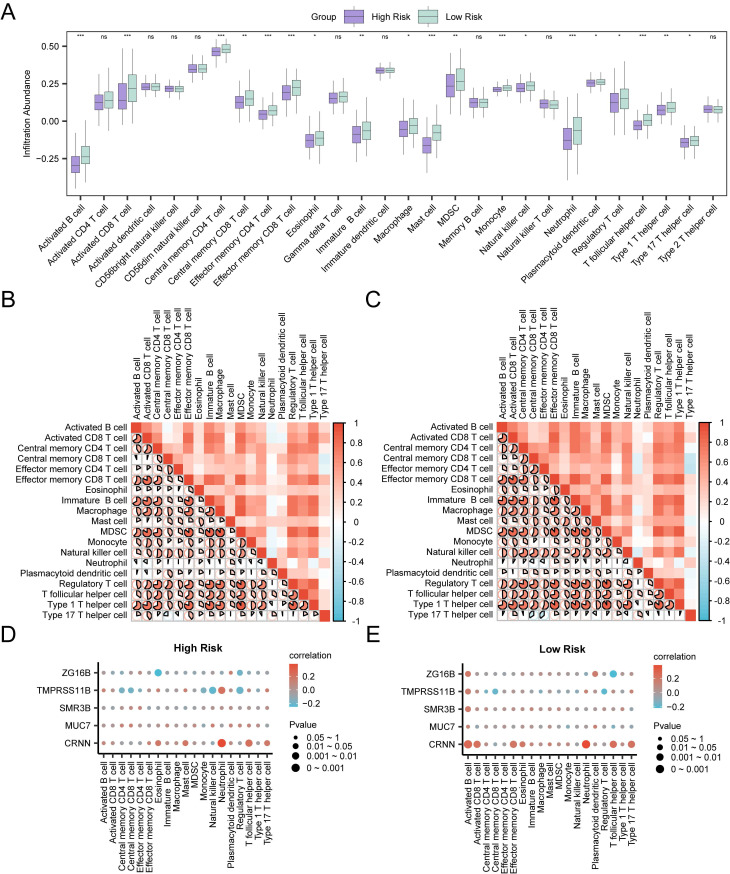
Purpose: Recent evidence suggests that the renin-angiotensin system (RAS) is involved in OSCC development. This study aimed to identify RAS-related gene (RASRG) biomarkers associated with OSCC prognosis through integrated bioinformatics analysis. Methods: First, we identified module genes by intersecting differentially expressed genes (DEGs) from the TCGA-OSCC dataset with RASRGs using weighted gene co-expression network analysis (WGCNA). Next, Cox and least absolute shrinkage and selection operator (LASSO) regression analyses were utilized to construct an OSCC risk model. We also created a nomogram incorporating risk scores and relevant clinical variables. Subsequently, receiver operating characteristic (ROC) analysis, Kaplan-Meier (KM) curve analysis, Cox regression analysis, and in vitro experiments were performed to assess the accuracy of the prognostic risk model and nomogram. Furthermore, protein-protein interaction (PPI) network, immune infiltration analysis and functional enrichment analyses were employed to reveal OSCC-related pathogenic genes and underlying mechanisms. Results: A novel OSCC risk model was established consisting of six key genes: CMA1, CTSG, OLR1, SPP1, AQP1, and PTX3. This six-gene signature effectively predicted the prognosis of patients with OSCC and served as a reliable independent prognostic parameter. Protein-protein interaction network analysis identified 5 hub genes and 13 miRNAs. Immune infiltration analysis indicated a possible association of the prognostic features of RASRGs with immunomodulation. Conclusion: In this study, we successfully constructed a risk model based on the six identified RAS-related DEGs as potential predictive biomarkers for OSCC.

Keywords: biomarkers; oral squamous cell carcinoma; prognosis; renin-angiotensin system-related genes; risk score.


Conflict of interest statement

Competing Interests: The authors have declared that no competing interest exists.

Figures

Figure 1
Figure 1
Flowchart illustrating the comprehensive analysis of publicly available data from TCGA and GEO databases.
Figure 2
Figure 2
Identification of RASRDEGs in OSCC. A Volcano plot depicting differentially expressed genes. B Venn diagram showing the intersection of DEGs and RASRGs. C Expression heatmap of the top 10 positively and negatively regulated RASRDEGs based on |log FC|. D Chromosomal mapping of RASRDEGs.
Figure 3
Figure 3
WGCNA of OSCC samples in the TCGA-OSCC dataset. A Group comparison diagram of RASScore between OSCC and control samples in the TCGA-OSCC dataset. B ROC curve for RASScore in the TCGA-OSCC dataset. C Scale-free net-work display of the best soft threshold from WGCNA. (The left panel shows the best soft threshold, and the right panel shows the network connectivity under different soft threshold conditions.) D-E Module clustering results of genes with the top 75% variance. (The upper part shows a hierarchical clustering dendrogram, and the lower part shows the gene modules.) F Results of correlation analysis between clustered modules and RASScore. G Venn diagram of the 43 RASRDEGs and modules MEgreen, MEblack, and MEyellow. ***p < 0.001.
Figure 4
Figure 4
Construction of the RASRGs-related prognostic risk model. A Forest plot showing the six key genes in the univariate Cox regression model. B-C Plots of the prognostic risk model and variable trajectories from the LASSO regression analysis. D Forest plot showing the six key genes in the multivariate Cox regression model.
Figure 5
Figure 5
Prognostic analysis of the RASRGs-related risk model. A Time-dependent ROC curve for OSCC samples in the TCGA-OSCC dataset. B Prognostic Kaplan-Meier (KM) curves for high-risk and low-risk OSCC groups. C Risk factor plot of the prognostic risk model for OSCC. D-E Forest plots of risk score and clinical information in univariate and multivariate Cox regression models. F A nomogram integrating risk scores and clinical parameters for precision prediction. G-I Calibration curves of the prognostic risk model for 1-, 3-, and 5-year overall survival (OS).
Figure 6
Figure 6
Validation of the expression patterns of key genes in OSCC tissues and cell lines. A Comparative qPCR analysis illustrating the expression disparities of key risk genes, including AQP1, OLR1, and SPP1, between normal oral epithelial cells (NOK) and OSCC cell lines. B-G Immunohistochemical staining of AQP1 (B, E), OLR1 (C, F), and SPP1 (D, G) in OSCC cancerous tissues and adjacent normal tissues. H-K Western blot analysis of AQP1 (H, J) and OLR1 (I, K) levels in NOK and OSCC cell lines. * p < 0.05, ** p < 0.01, *** p < 0.001, **** p < 0.0001.
Figure 7
Figure 7
PPI and regulatory network, MSI, and TMB analyses. A PPI network of 15 DEGs. B mRNA-miRNA regulatory network of hub genes. C Cloud and rain diagram of friend analysis. D-E Group comparison plots of MSI scores (D) and TMB scores (E) between different OSCC risk groups. * p < 0.05, ** p < 0.01.
Figure 8
Figure 8
Immune Infiltration analyses of Risk Groups. A Group comparison plots of immune cells in the high-risk group and the low-risk group of OSCC samples. B-C Correlation heatmaps of immune cells infiltration abundance in the high-risk group (B) and the low-risk group (C) of OSCC samples. D-E Bubble plots of correlation between immune cell infiltration abundance and Hub Genes in the high-risk (D) and low-risk (E) groups of OSCC.

Similar articles

References

    1. Siegel RL, Miller KD, Jemal A. Cancer statistics, 2018. CA Cancer J Clin. 2018;68(1):7–30. - PubMed
    1. Rivera C. Essentials of oral cancer. Int J Clin Exp Pathol. 2015;8(9):11884–94. - PMC - PubMed
    1. Sung H, Ferlay J, Siegel RL. et al. Global Cancer Statistics 2020: GLOBOCAN Estimates of Incidence and Mortality Worldwide for 36 Cancers in 185 Countries. CA Cancer J Clin. 2021;71(3):209–249. - PubMed
    1. Kumar R, Thomas CM, Yong QC, Chen W, Baker KM. The intracrine renin-angiotensin system. Clin Sci (Lond) 2012;123(5):273–84. - PMC - PubMed
    1. Arendse LB, Danser AHJ, Poglitsch M. et al. Novel Therapeutic Approaches Targeting the Renin-Angiotensin System and Associated Peptides in Hypertension and Heart Failure. Pharmacol Rev. 2019;71(4):539–570. - PMC - PubMed

MeSH terms

Substances