. 2025 Apr 22;22(10):2318-2332.
doi: 10.7150/ijms.109721. eCollection 2025.

Cracking Chordoma's Conundrum: Immune Checkpoints Provide a Potential Modality

Affiliations

Cracking Chordoma's Conundrum: Immune Checkpoints Provide a Potential Modality

Weihai Liu et al. Int J Med Sci. .

Abstract

Objectives: Chordoma, a rare malignant tumor, is notably resistant to conventional treatments including chemotherapy, radiotherapy, and targeted approaches. Immunotherapy, successful in treating other cancer types, presents a promising avenue. However, the immune microenvironment of chordoma is poorly understood, highlighting the need to investigate immune checkpoints and their potential as therapeutic targets in this context. Methods: We performed an integrated analysis of chordoma using public datasets (GSE224776, GSE56183, GSE239531) and our RNA-seq data (11 samples). Differential expression analysis (limma), gene set enrichment analysis (GSEA, clusterProfiler), immune cell infiltration assessment (ESTIMATE, immunedeconv), weighted gene co-expression network analysis (WGCNA), consensus clustering, and machine learning were employed to identify key immune-related gene modules, immunogenic subtypes, and central immune regulators. Results: Hierarchical clustering and principal component analysis segregated chordoma from control samples post quality control. Differential expression analysis identified 2825 upregulated and 1693 downregulated genes, with significant upregulation of immune checkpoints, including PD-1 and CTLA-4. GSEA highlighted enhanced immune-related processes, particularly inflammatory responses, antigen presentation, and immune cell activation. Immune cell deconvolution demonstrated selective enrichment of memory T cells and macrophages, alongside downregulation of neutrophils and decreased effector cell scores. Consensus clustering identified a highly immunogenic chordoma subtype (Cluster 1), and WGCNA and machine learning converged on CCR7 as a central immune regulator, with core T cell-associated genes correlating with immune cell distribution patterns. Conclusion: This study characterizes the chordoma immune landscape, highlighting elevated immune checkpoints, distinct immunogenic subtypes, and a T cell-centered regulatory network. These findings support immune checkpoint inhibitors and other immunotherapies as promising treatments.

Keywords: chordoma; differential expression; immune checkpoint inhibitors; immune checkpoints.


Conflict of interest statement

Competing interests: The authors have declared that no competing interest exists.

Figures
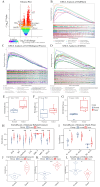
Figure 1
Figure 1
Transcriptional and immunological profiling reveals enhanced immune signatures in chordoma. (A) Volcano plot showing differential gene expression between chordoma and normal tissues. Significantly dysregulated genes (|log2 fold change| > 1, P < 0.05) are highlighted, with key upregulated genes (HLA-DQA1, GDA, CXCL11, CXCL9, ADAMDEC1) shown in red and downregulated genes (SPOCK3, NRK, MYH8, DLK1, SLN) in blue. (B-D) Gene Set Enrichment Analysis (GSEA) demonstrating enrichment of immune-related pathways in chordoma using different gene set collections: (B) Hallmark gene sets, (C) GO Biological Process, and (D) KEGG pathways. Running enrichment scores (top) and gene set member positions (bottom) are shown for each analysis. (E-G) Box plots comparing immune-related scores between normal and tumor tissues (n=6 per group): (E) ImmuneScore, (F) StromalScore, and (G) ESTIMATEScore. Center lines show medians; box limits indicate 25th and 75th percentiles; whiskers extend to 1.5× interquartile range. (H) Violin plots showing enrichment scores of seven immune-related gene sets in normal versus tumor samples. (I) Distribution of immune checkpoint scores across three categories: TC-ICGs, IC-ICGs, and TIC-ICGs. (J-L) Violin plots comparing (J) immunophenoscore, (K) MHC score, and (L) effector cell score between normal and tumor tissues. For all statistical comparisons: *P < 0.05, **P < 0.01, ***P < 0.001.
Figure 2
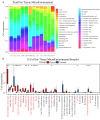
Figure 2
Comprehensive immune cell profiling reveals distinct infiltration patterns in chordoma. (A) Stacked bar plot showing the relative proportions of immune cell populations in chordoma (Ch1-CH98) and normal (N1-Not3) samples as determined by XCell algorithm. Colors represent different immune cell types. (B) Box plot comparison of immune cell type abundances between normal and tumor tissues. Red bars indicate tumor samples; blue bars indicate normal samples. Significant differences are marked with asterisks (*P < 0.05, **P < 0.01, ***P < 0.001, ****P < 0.0001). Box plot elements as in Figure 1.
Figure 3
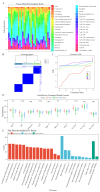
Figure 3
Consensus clustering identifies a distinct immune-enriched chordoma subtype. (A) Heatmap showing immune cell composition across 32 chordoma samples based on XCell analysis. (B) Consensus matrix for k=3 clustering shows robust cluster separation. (C) Cumulative distribution function (CDF) curves validating optimal cluster number selection. (D) Violin plots comparing immune-related gene set enrichment scores across three identified clusters. Cluster1 shows distinctly higher scores for multiple immune signatures. Statistical significance indicated as in Figure 1. (E) Bar plot showing the most enriched GO terms in Cluster1, categorized by biological process (red), cellular component (blue), and molecular function (green). Length of bars indicates gene count for each term.
Figure 4
Figure 4
WGCNA identifies immune-related gene modules in chordoma. (A) Cluster dendrogram showing gene modules identified by WGCNA. Different colors represent distinct modules. (B) Heatmap showing module-trait relationships. Colors indicate correlation strength (red = positive, blue = negative); numbers in parentheses show P-values. (C,D) Scatter plots showing correlation between module membership and gene significance for (C) MEpurple module (cor=0.82, P=1.8e-26) and (D) MEgreen module (cor=0.7, P=7.8e-64). (E,F) GO enrichment analysis of significant genes in (E) MEpurple and (F) MEgreen modules, categorized by biological process (red), cellular component (blue), and molecular function (green).
Figure 5
Figure 5
Integration of PPI network analysis and machine learning identifies CCR7 as a key immune regulator. (A) PPI network of MEgreen module genes. Node size reflects connectivity degree. (B) High-scoring cluster identified by MCODE algorithm showing core immune-related genes. Node color intensity indicates degree of connectivity. (C) LASSO regression analysis showing optimal parameter selection. (D) Top 10 genes identified by XGBoost algorithm, ranked by importance score (gain). (E) Boruta algorithm results showing confirmed (green), tentative (red), and rejected (black) features. (F) SVM-RFE performance curve showing classification accuracy across different numbers of features. (G) Venn diagram showing overlap of genes identified by four machine learning approaches, highlighting CCR7 as the common candidate.
Figure 6
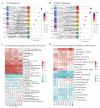
Figure 6
Core T cell-associated genes demonstrate significant correlation with immune cell populations. (A) GO enrichment analysis of core genes showing significant pathways related to T cell function. Left bars indicate gene sets, with bar lengths representing gene ratios. Circle size indicates term ratio, and color gradient shows gene ratio. (B) KEGG pathway enrichment analysis highlighting involvement in hematopoietic and immune-related pathways. Circle size and color coding follow the same scheme as in (A). (C) Correlation heatmap between hub genes and immune cell populations based on XCell algorithm. Color intensity indicates correlation strength (red = positive, blue = negative); asterisks denote statistical significance (*P < 0.05, **P < 0.01). (D) Correlation heatmap between hub genes and immune cell populations based on Cibersort algorithm, showing distinct correlation patterns particularly with T cell subsets.

Similar articles

References

    1. Chambers KJ, Lin DT, Meier J, Remenschneider A, Herr M, Gray ST. Incidence and survival patterns of cranial chordoma in the United States. Laryngoscope. 2014;124:1097–102. - PubMed
    1. Stiller CA, Trama A, Serraino D, Rossi S, Navarro C, Chirlaque MD. et al. Descriptive epidemiology of sarcomas in Europe: report from the RARECARE project. Eur J Cancer. 2013;49:684–95. - PubMed
    1. Sebro R, DeLaney T, Hornicek F, Schwab J, Choy E, Nielsen GP. et al. Differences in sex distribution, anatomic location and MR imaging appearance of pediatric compared to adult chordomas. BMC Med Imaging. 2016;16:53. - PMC - PubMed
    1. Shinojima N, Ozono K, Yamamoto H, Abe S, Sasaki R, Tomita Y. et al. Lynch syndrome-associated chordoma with high tumor mutational burden and significant response to immune checkpoint inhibitors. Brain Tumor Pathol. 2023;40:185–90. - PMC - PubMed
    1. Aguiar Júnior S, Andrade WP, Baiocchi G, Guimarães GC, Cunha IW, Estrada DA. et al. Natural history and surgical treatment of chordoma: a retrospective cohort study. Sao Paulo Med J. 2014;132:297–302. - PMC - PubMed

MeSH terms

LinkOut - more resources