[Preprint]. 2025 May 6:rs.3.rs-6523050.
doi: 10.21203/rs.3.rs-6523050/v1.

HDAC11 promotes renal fibrosis by induing partial epithelial-mesenchymal transition and G2/M phase arrest in renal epithelial cells

Affiliations

HDAC11 promotes renal fibrosis by induing partial epithelial-mesenchymal transition and G2/M phase arrest in renal epithelial cells

Yingjie Guan et al. Res Sq. .

Abstract

Background: Histone deacetylase 11 (HDAC11) is the sole member of class IV HDACs, implicated in tumor growth, immune regulation, and oxidative stress injury. Its specific role in renal fibrosis and underlying mechanisms remains unclear.

Methods: The global knockout of HDAC11 mice and FT895, a selective inhibitor of HDAC11, were utilized to assess the role of HDAC11 in renal fibrosis following unilateral ureteral obstruction (UUO) injury in mice. Immunostaining was employed to analyze renal expression of HDAC11 and infiltration of macrophages. Immunoblot analysis was used to analyze the expression and/or phosphorylation of proteins associated with partial epithelial-mesenchymal transition (pEMT) in the kidney and cultured renal proximal tubular cells (RTPCs). RT-PCR was used to analyze the expression of various proinflammatory cytokines.

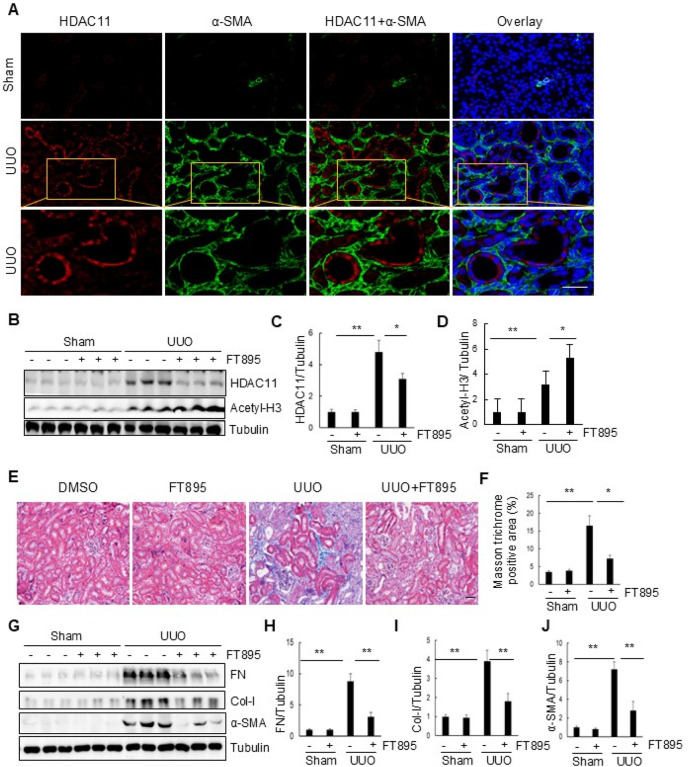
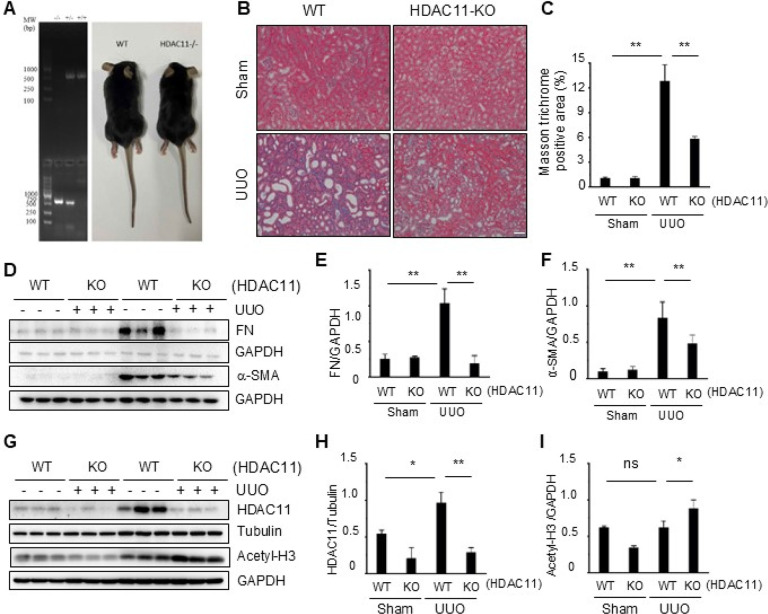
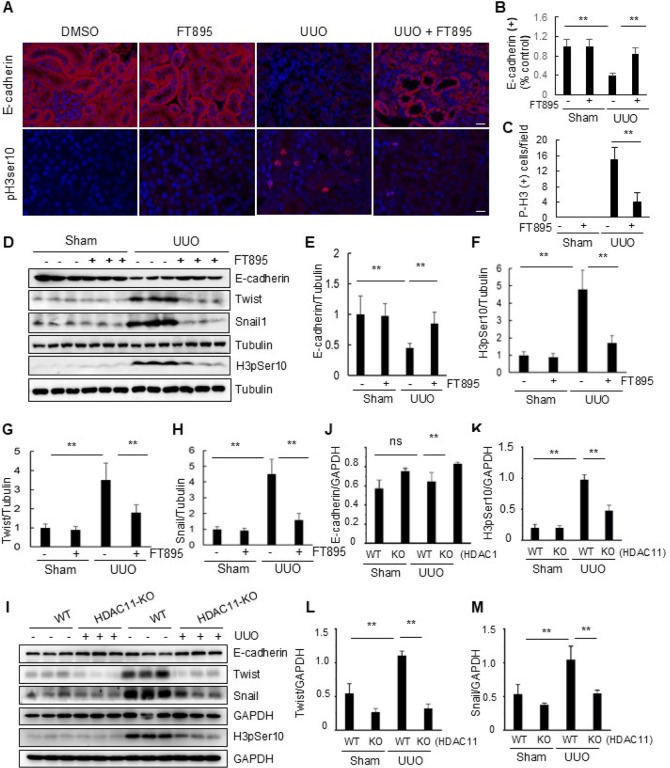
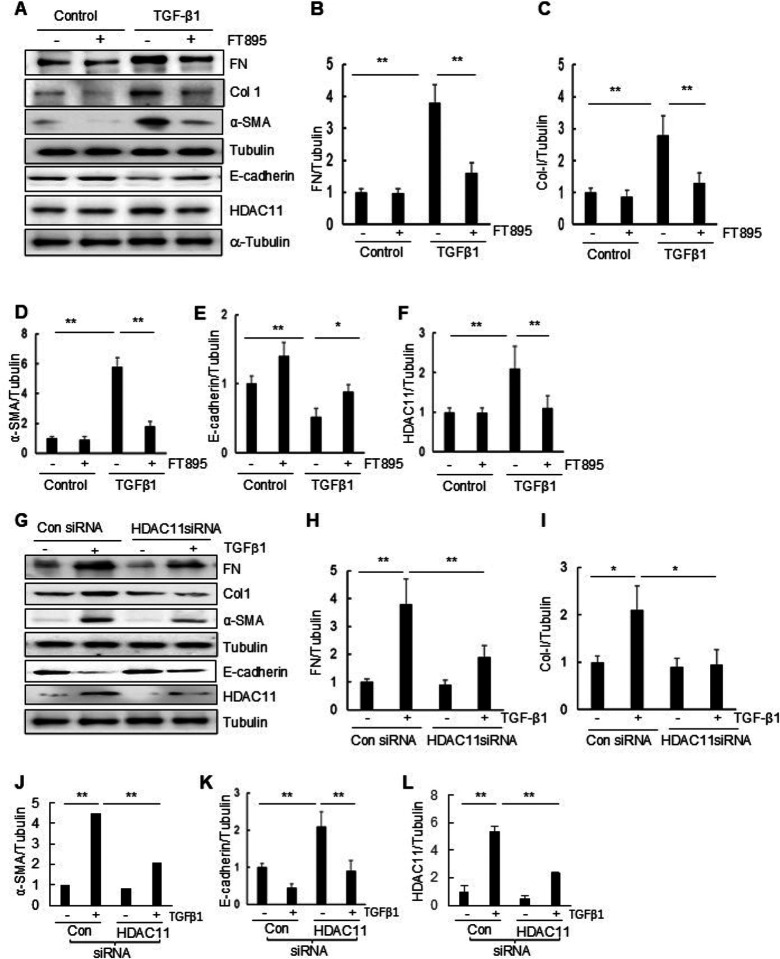
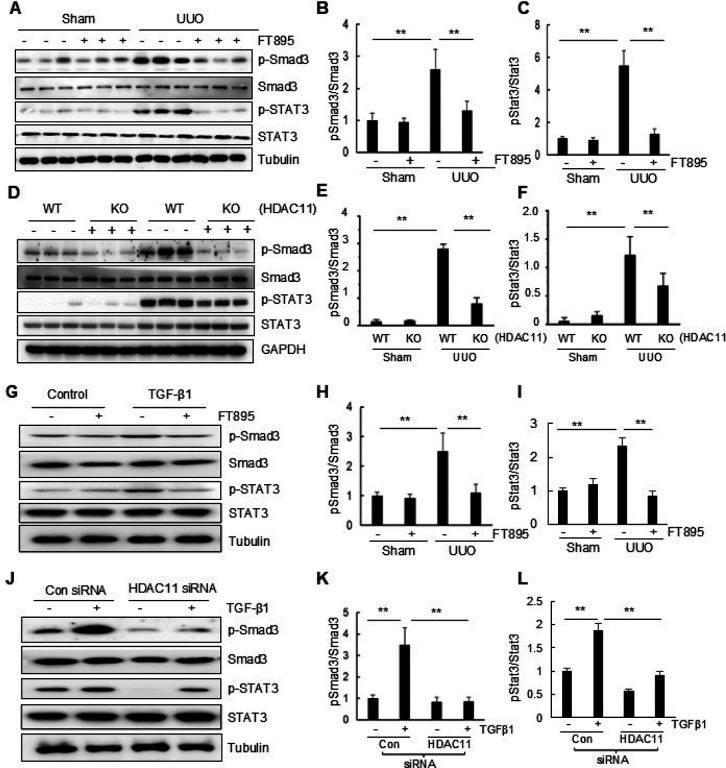
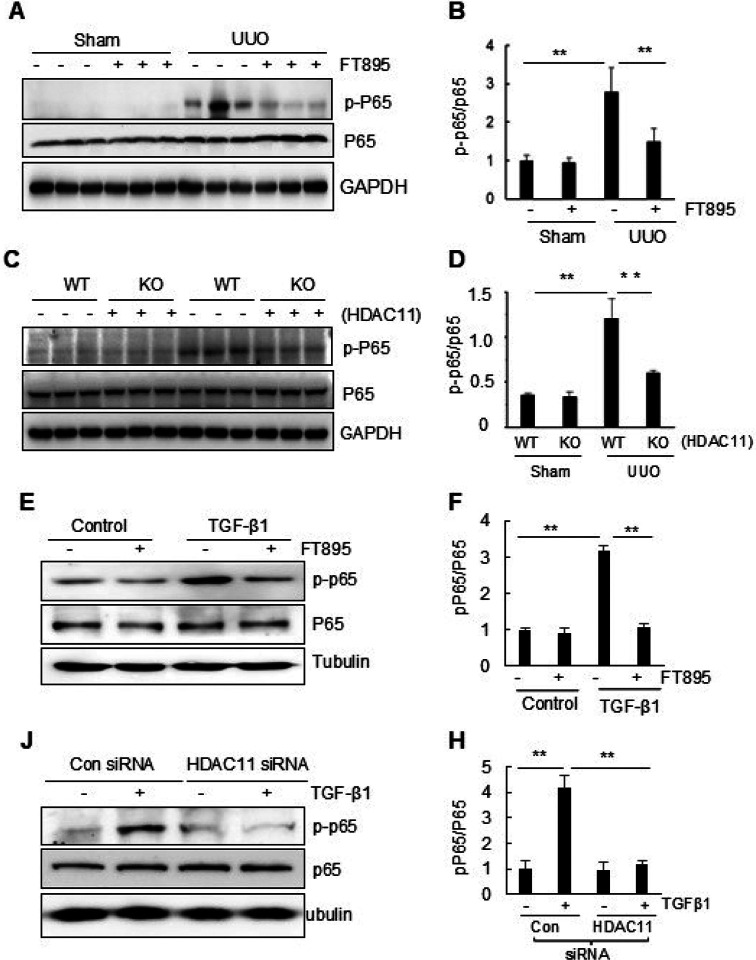
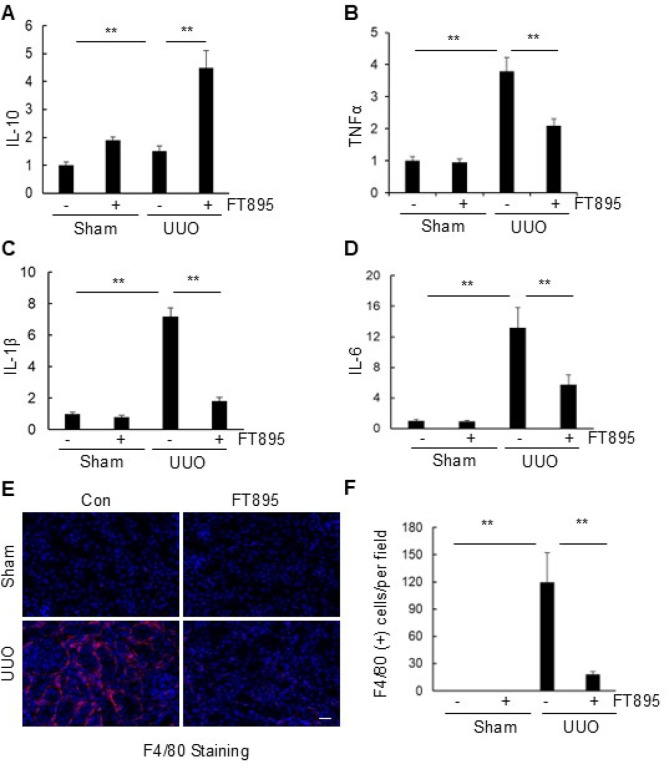
Results: HDAC11 was predominantly expressed in renal epithelial cells, with its expression increasing in the kidney following UUO. This upregulation correlated with excessive collagen deposition and was associated with increased levels of fibronectin, collagen I, and α-smooth muscle actin, alongside reduced E-cadherin expression. Both global deletion of HDAC11 and treatment with the selective inhibitor FT895 significantly reduced collagen accumulation and the expression of fibronectin and collagen I, while preserving E-cadherin levels. HDAC11 inhibition also led to a decrease in histone H3 phosphorylation at serine 10, a marker of G2/M cell cycle arrest, and reduced the expression of Snail and Twist-key transcription factors involved in pEMT. Similar effects were observed in TGFb1-stimulated renal proximal tubular cells in vitro treated with FT895 or subjected to HDAC11 silencing via siRNA. Additionally, FT895 treatment attenuated the expression of multiple pro-inflammatory cytokines and reduced macrophage infiltration in obstructed kidneys. Both pharmacological inhibition and genetic ablation of HDAC11 suppressed activation of profibrotic signaling pathways, including Smad3, STAT3, and NF-κB, in both in vitro and in vivo models.

Conclusions: These findings indicate that HDAC11 is crucial for renal fibrosis development by promoting pEMT and G2/M phase cell cycle arrest in renal epithelial cells through multiple profibrotic signaling pathways. Therefore, targeting HDAC11 may be a promising therapeutic strategy to alleviate renal fibrosis.

Keywords: FT895; Histone deacetylase 11; Smad3; kidney fibrosis; partial epithelial-mesenchymal transition; signal transducer and activator of transcription 3 Nuclear factor kappa B; unilateral ureteral obstruction.


Conflict of interest statement

Competing interests The authors declare that they have no conflict of interest.

Figures

Figure 1
Figure 1. Expression of HDAC11 and the effect of FT895 on renal fibrosis in obstructed kidneys.
(A) Photomicrographs illustrate co-staining of a-SMA and HDAC11 in the tissue section of the obstructed kidney (original magnification, 400X). (B) The prepared tissue lysates from sham-operated or obstructed kidneys of mice administered with or without FT895 were subjected to immunoblot analysis with antibodies against HDAC11, acetylated Histone 3, or Tubulin. (C and D) The levels of HDAC11, acetylated histone 3, or Tubulin were quantified by densitometry, and HDAC11 (C) and acetylated histone 3 (D) levels were normalized to GAPDH. Values are means ± SD (n = 6). **P<0.01, *P<0.05. (E) Photomicrographs illustrating Masson trichrome staining (blue) of kidney tissue (original magnification, 400 x). (F) The Masson trichrome–positive tubulointerstitial area was analyzed relative to the whole area from 10 random cortical fields. Data are represented as means±SD (n = 6). (G) Kidney tissue lysates were subjected to immunoblot analysis with antibodies against fibronectin (FN), collagen I (Col), a-SMA, or Tubulin. (H–I) Expression levels of FN, Col-I, a-SMA, or Tubulin were quantified by densitometry, and the levels of FN (H), Col-I (I), and a-SMA (I) were normalized with Tubulin. Values are means ± SD (n = 6). *P<0.05, **P<0.01.
Figure 2
Figure 2. Global deletion of HDAC11 attenuates renal fibrosis in mice.
(A) PCR analysis of HDAC11 expression in RNA extracted from HDAC11 WT and KO mouse tissue (Left). The DNA molecular weight size marker is shown in the far-left lane; similar size of HDAC11 WT and KO mice (right). (B) Photomicrographs illustrating Masson trichrome staining (blue) of kidney tissue (original magnification, 400 x). (C) The Masson trichrome–positive tubulointerstitial area was analyzed relative to the whole area from 10 random cortical fields. Data are represented as means±SD (n = 6). **P<0.01. (D, G) Kidney tissue lysates were subjected to immunoblot analysis with antibodies against proteins as indicated. All these proteins were quantified by densitometry, and Fibronectin (FN) (E), a-SMA (F), Acetyl-histone H3 (Acetyl-H3) (I) were normalized GAPDH, respectively. HDAC11 was normalized with Tubulin (H). Values are means ± SD (n = 6). *P<0.05, **P<0.01.
Figure 3
Figure 3. Pharmacological or genetic blockade of HDAC11 inhibits partial EMT and renal epithelial cells arrested in the G2/M phase of the cell cycle in obstructed kidneys.
(A) Photomicrographs illustrate staining of E-cadherin and pH3Ser10 in the tissue section of the kidney after treatments as indicated (original magnification, 400x). The tubular cells with positive staining of E-cadherin (B) and pH3Ser10 (C) were calculated in 20 high-power fields and expressed as means ± SD. **P<0.01. Kidney tissue lysates were subjected to immunoblot analysis with antibodies against proteins as indicated (D, I). Expression levels of E-cadherin (E, J), pH3Ser10 (F, K), Twist (G, L), Snail (H, M) were quantified by densitometry and normalized with GAPDH or Tubulin as indicated. Values are means ± SD (n = 6). **P<0.01.
Figure 4
Figure 4. Treatment with FT895 or knockdown of HDAC11 with siRNA inhibits renal EMT.
(A-G) Serum-starved RTPCs were pretreated with 10 mM FT895 for 1 h and then exposed to TGF-β1 (5 ng/ml) for an additional 24 h. (H-N) Serum-starved RTPC cells were transfected with siRNA targeting HDAC11 or control siRNA and then incubated in TGF-β1 (5 ng/ml) for an additional 24 h. Cell lysates were then prepared and subjected to immunoblot analysis with antibodies against proteins as indicated. Expression levels of fibronectin (FN) (B, I), collagen (Col-I) (C, J), a-SMA (D, K), E-cadherin (E, L), HDAC11 (F, M), or acetylated H3 (Ace-H3)(G, N) were quantified by densitometry and normalized with a-tubulin, respectively. Values are the mean ± SD of at least 3 independent experiments. *P<0.05, **P<0.01
Figure 5
Figure 5. Pharmacological and genetic inhibition of HDAC11 reduces phosphorylation of Smad and STAT3 in obstructed kidneys and cultured renal interstitial fibroblasts.
Kidney tissue lysates were prepared and subjected to immunoblot analysis with antibodies to proteins as indicated (A-F). Serum-starved RTPCs were treated with 10 mM FT895 for 1 h followed by exposure of cells to TGF-β1 (5 ng/ml) for an additional 24 h (G, F) or transfected with siRNA targeting HDAC11 or control siRNA and then incubated in TGF-β1 (5 ng/ml) for an additional 24 h (J-L). Cell lysates were subjected to immunoblot analysis with antibodies against proteins as indicated (G, L). Expression levels of the proteins were quantified by densitometry. Phospho-Smad3 was normalized to its total Smad3 protein level (B, E, H, K); Phospho-STAT3 was normalized to its total STAT3 protein level (C, F, I, L). Values are means ± SD (n = 6) for immunoblot of kidney lysates; values are the mean ± SD of at least 3 independent experiments for immunoblot of cell lysates. **P<0.01.
Figure 6
Figure 6. Inhibition or knockdown of HDAC11 inhibits activation of STAT3 and NF-kB signaling in obstructed kidneys and cultured RTPC cells.
(A-C) Kidney tissue lysates were prepared and subjected to immunoblot analysis with antibodies against phospho-STAT3 (p-STAT3) (Tyr705), phospho–NF-kB (p-P65), or total STAT3 and P65. All of those proteins were quantified by densitometry, and phospho-STAT3 (B) and phospho–NF-kB (C) were normalized to their total protein levels. Values are means ± SD (n = 6). **, P<0.01, compared with group indicated. D and E, FT895 treatment inhibits activation of the STAT3 and NF-kB signaling cultured RTPC cells. Serum-starved RTPCs were treated with 10 mM FT895 for 1 h followed by exposure of cells to TGF-β1 (5 ng/ml) for an additional 24 h (D). F and G, Serum-starved RTPC cells were transfected with siRNA targeting HDAC11 or scrambled siRNA (control siRNA) and then incubated in TGF-β1 (5 ng/ml) for an additional 24 h. Cell lysates were subjected to immunoblot analysis with antibodies against p-STAT3, total STAT3, p-P65, P65 or a-tubulin. Expression levels of the proteins were quantified by densitometry, and p-STAT3 (E) and p–P65 (C) were normalized to their total protein levels. Values are the mean ± SD of at least 3 independent experiments. **P<0.01.
Figure 7
Figure 7. Inhibition of HDAC11 limits inflammation and macrophage infiltration in the kidneys after UUO injury.
Quantitative PCR (qPCR) in the renal cortex was used to examine the messenger RNA (mRNA) expression of IL-10 (A), TNF-α (B), IL-1β (C) and IL-6 (D) in obstructed kidneys and their sham control. Data are represented as means±SD (n = 6). ** P<0.01, compared with group indicated. E, immunostaining of F4–80 showed that macrophage infiltration was up-regulated in obstructed kidneys and considerably restricted in FT895 treated kidneys (original magnification 200 X). (F). Histogram shows quantification of the F4–80 macrophage was significantly upregulated in UUO mice compared with control mic and significantly decreased in FT895 treated group Positively stained cells were counted in 10 fields, and mean numbers per field. Data are represented as means±SD (n = 3). **P<0.01.

Similar articles

References

    1. Arts J., King P., Marien A., Floren W., Belien A., Janssen L., Pilatte I., Roux B., Decrane L., Gilissen R., et al. (2009). JNJ-26481585, a novel “second-generation” oral histone deacetylase inhibitor, shows broad-spectrum preclinical antitumoral activity. Clin Cancer Res 15, 6841–6851. - PubMed
    1. Barter M.J., Butcher A., Wang H., Tsompani D., Galler M., Rumsby E.L., Culley K.L., Clark I.M., and Young D.A. (2022). HDAC6 regulates NF-kappaB signalling to control chondrocyte IL-1-induced MMP and inflammatory gene expression. Sci Rep 12, 6640. - PMC - PubMed
    1. Bello A.K., Okpechi I.G., Levin A., Ye F., Damster S., Arruebo S., Donner J.A., Caskey F.J., Cho Y., Davids M.R., et al. (2024). An update on the global disparities in kidney disease burden and care across world countries and regions. Lancet Glob Health 12, e382–e395. - PubMed
    1. Castillo R.F. (2023). Pathophysiologic Implications and Therapeutic Approach of Klotho in Chronic Kidney Disease: A Systematic Review. Lab Invest 103, 100178. - PubMed
    1. Chen H., Xie C., Chen Q., and Zhuang S. (2022). HDAC11, an emerging therapeutic target for metabolic disorders. Front Endocrinol (Lausanne) 13, 989305. - PMC - PubMed

Publication types

LinkOut - more resources