[Preprint]. 2025 May 8:rs.3.rs-6481967.
doi: 10.21203/rs.3.rs-6481967/v1.

Spatially Resolved Panoramic in vivo CRISPR Screen via Perturb-DBiT

Affiliations

Spatially Resolved Panoramic in vivo CRISPR Screen via Perturb-DBiT

Rong Fan et al. Res Sq. .

Abstract

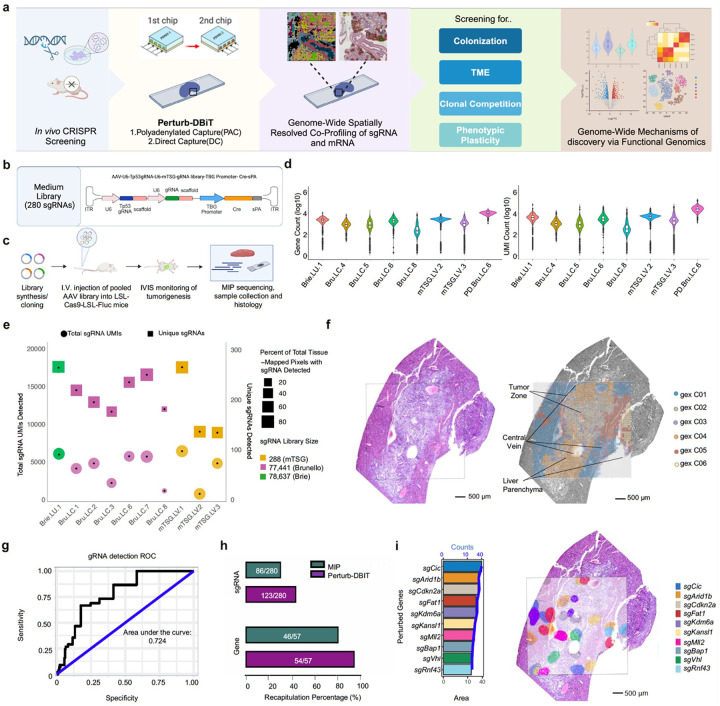
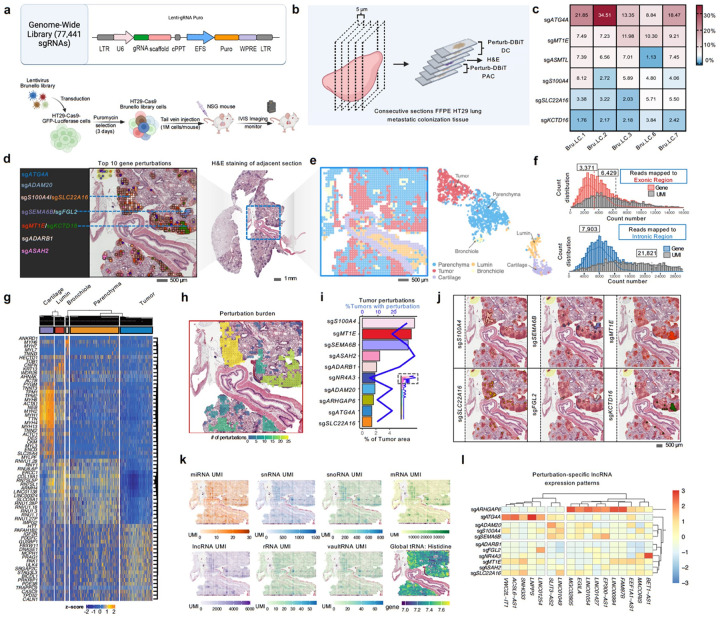
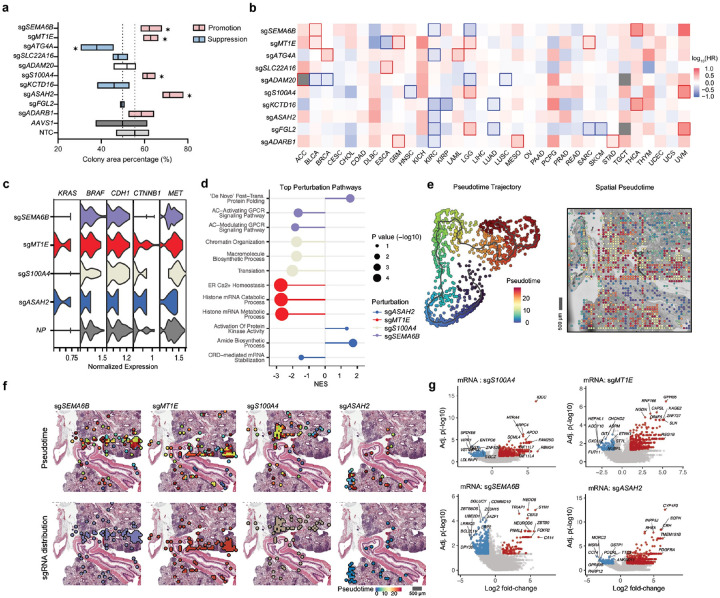
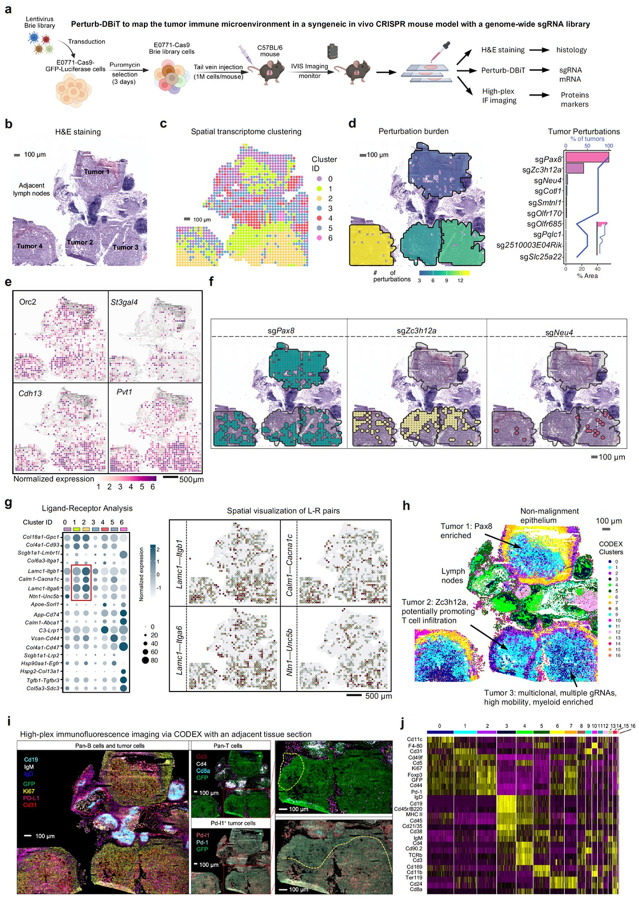
Spatially resolved in vivo CRISPR screening integrates gene editing with spatial transcriptomics to examine how genetic perturbations alter gene expression within native tissue environments. However, current methods are limited to small perturbation panels and the detection of a narrow subset of protein-coding RNAs. We present Perturb-DBiT, a distinct and versatile approach for the simultaneous co-sequencing of spatial total RNA whole-transcriptome and single-guide RNAs (sgRNAs), base-by-base, on the same tissue section. This method enables unbiased discovery of how genetic perturbations influence RNA regulation, cellular dynamics, and tissue architecture in situ. Applying Perturb-DBiT to a human cancer metastatic colonization model, we mapped large panels of sgRNAs across tumor colonies in consecutive tissue sections alongside their corresponding total RNA transcriptomes. This revealed novel insights into how perturbations affect long non-coding RNA (lncRNA) co-variation, microRNA-mRNA interactions, and global and distinct tRNA alterations in amino acid metabolism linked to tumor migration and growth. By integrating transcriptional pseudotime trajectories, we further uncovered the impact of perturbations on clonal dynamics and cooperation. In an immune-competent syngeneic mouse model, Perturb-DBiT enabled investigation of genetic perturbations within the tumor immune microenvironment, revealing distinct and synergistic effects on immune infiltration and suppression. Perturb-DBiT provides a spatially resolved comprehensive view of how genetic knockouts influence diverse molecular and cellular responses including small and large RNA regulation, tumor proliferation, migration, metastasis, and immune interactions, offering a panoramic perspective on perturbation responses in complex tissues.


Conflict of interest statement

Competing interests: A.B., X.T., Z.B., S.C. and R.F. are inventors of a patent application related to this work. R.F. is scientific founder and adviser for IsoPlexis, Singleron Biotechnologies, and AtlasXomics. The interests of R.F. were reviewed and managed by Yale University Provosťs Office in accordance with the University's conflict of interest policies. WZ, TT, NP are the employees of Aspect Analytics. Other authors declare no competing interests.

Figures

Figure 1
Figure 1. Perturb-DBiT overview, technical performance, and demonstration of robust performance revealing tumor clonal heterogeneity in medium-sized CRISPR-screening libraries.
(a) Schematic of Perturb-DBiT and its applications. (b) Schematic of the AAV-CRISPR vector containing two sgRNA expressing cassettes used for Perturb-DBiT with the medium (288 sgRNA library). (c) Schematic of direct in vivo AAV-CRISPR liver screen design. (d) Violin plot of detected gene/UMI counts per spatial spot from gene expression data across 8 samples utilizing Perturb-DBiT co-profiling. (e) Bubble plot depicting Perturb-DBiT sgRNA capture diversity. (f) Detection of a medium-sized guide library (288 sgRNAs) in a murine model of autochthonous liver cancer. Left: Liver tissue stained with hematoxylin and eosin (H&E), demonstrating the ROI used for Perturb-DBiT. Right: spatial clustering of gene expression data overlaid on brightfield image, labeled with pathologist annotations. (g) Receiver-operator curve comparing the sgRNA detection by 50-micron Perturb-DBiT vs the traditional pooled sequencing method (MIP). (h) Recapitulation analysis comparing sgRNA capture accuracy between Perturb-DBiT and the traditional pooled sequencing method (MIP). (i) Left: Bar plot of the top 10 gene perturbations detected by 50-micron Perturb-DBiT. The area and total counts of the gene perturbations are presented by bars and blue line, respectively. Right: Spatial visualization of the top gene perturbations, depicted by color-coded 2D-density maps atop an autochthonous liver tumor ROI.
Figure 2
Figure 2. Perturb-DBiT mapping reveals high-resolution tumor clonality by integrating with histology. (
a) Top: Schematic of Lenti-gRNA Puro construct. Right: Schematic showing the HT29 lung metastatic colonization model. Bottom: Schematic showing the development of HT29 lung metastatic colonization model. (b) Schematic depicting six adjacent sections taken from FFPE HT29 metastatic colonization tissue, three of which were used for Perturb-DBiT DC, two for Perturb-DBiT PAC, and the middle section used for H&E staining. (c) Relative abundance of sgRNA-associated UMIs within the Region of Interest (ROI) compared to total UMIs, for the top six sgRNA hits across the six sections shown in 2B. (d)Right: Spatial mapping of tissue sections collected from HT29 lung metastatic colonization model transduced with genome-scale Brunello sgRNA library. Left: Combined spatial distribution of top 10 sgRNAs. (e) Left: Unsupervised clustering of the combined exonic and intronic expression matrix revealed five transcriptomic clusters. Right: UMAP analysis revealing the five distinct clusters closely matching tissue histology: parenchyma, tumor, cartilage, lumin, and bronchiole. (f) Distribution of detected gene/UMI counts per spatial spot from reads mapped to exonic or intronic region. (g) Top ranked DEGs defining each cluster in Figure 2E. (h) Spatial distribution of perturbation burden calculated as the area of spots with a detected sgRNA within a specified tumor region. (i) Bar plot of the top 10 gene perturbations detected by 50-micron Perturb-DBiT. The area and total counts of the gene perturbations are presented by bars and blue line, respectively. (j) Spatial colocalization of top enriched sgRNA pairs. (k) Spatial count maps of different non-coding RNAs and global tRNA histidine plot. (l) Heatmap depicting perturbation-specific lncRNA expression patterns with the following filters: adj. p-val<0.05, absolute-log-fold-change >1, and gene detection difference between groups >25%.
Figure 3
Figure 3. Spatial mapping of small non-coding RNAs in HT29 lung metastatic colonization model.
(a) Proportion of reads mapped to different RNA categories. (b) Heatmap depicting perturbation-specific tRNA expression patterns with the following filters: adj. p-val<0.05, absolute-log-fold-change >1, and gene detection difference between groups >25%. (c) Top: DE tRNA volcano plot of sgADARB1 perturbation versus all other perturbed spots. Bottom: DE tRNA volcano plot of sgMT1Eperturbation versus all other perturbed spots. (d) Spatial distribution of sgADARB1 (yellow) and sgMT1E (red) perturbation. (e) Heatmap of lamellipodium organization pathway gene expression across top sgRNA perturbations. (F) GO Pathway analysis of sgMT1E differentially expressed mRNA (LFC>1, adj.p-val>0.05). (g) miRNA-mRNA interaction predictions for top sgRNA hits. (h) DE miRNA volcano plot of sgMT1Eperturbation versus all other perturbed spots. (i) Inverse correlation between hsa-miR-21 and target gene expression for select target genes from 3I.(j) Left: spatial plot of hsa-miR-21(orange) in sgMT1E knockout cells (purple) overlaid on brightfield image of the ROI. Right: spatial plot of hsa-miR-21(orange) in tumor cluster from 2E (purple) overlaid on brightfield image of the ROI. (k) Top: Representative images of scratch assay depicting wound closure in HT29 cells with NTC or sgMT1E knockdown at 24,48,72 or 96 hours. Bottom: Comparative analysis of wound closure in NTC or sgMT1E knockdown cells using a wound healing assay. Statistical significance was determined using two-way ANOVA.
Figure 4
Figure 4. Perturb-DBiT reveals distinct tumor suppressor/promoter programs.
(a) Colony formation assay results of top enriched sgRNA from HT29 lung metastatic colonization model. (b) Hazard Ratio plot of top enriched sgRNA from HT29 lung metastatic colonization model. Squares surrounded by colored boxes represent significant differences in hazard ratios. (c) Violin plot of the expression of 5 selected oncogenes, compared between pUMAP clusters. (d) Pathway analysis of top perturbations. (e) Left: Monocle3 pseudotime analysis of sgRNA detected from HT29 lung metastatic colonization model. Right: spatial pseudotime visualization. (f) Top: Pseudotime analysis of top 5 enriched sgRNAs detected by Perturb-DBiT. Bottom: spatial mapping of top 5 enriched sgRNAs detected by Perturb-DBiT, overlaid on the brightfield image of the ROI. (g) Volcano plots of the transcriptomic DEG analysis for top enriched sgRNA perturbations.
Figure 5
Figure 5. Perturb-DBiT with a CRISPR library in syngeneic metastatic tumor model highlights genes that modulate the structural features of tumors and TME.
(a) Schematic showing the E0771 syngeneic in vivo CRISPR mouse model. (b) H&E-stained image of E0771 syngeneic lung fresh-frozen tissue section with labeling of four anatomically distinct tumor regions and adjacent lymph nodes. (c) Unsupervised clustering of the gene expression matrix revealing 6 distinct clusters overlain on brightfield image of tissue section (right). (d) Left: Spatial distribution of perturbation burden calculated as the area of spots with a detected sgRNA within a specified region. Right: Bar plot of the top 10 gene perturbations detected by 50-micron Perturb-DBiT. The area and total counts of the gene perturbations are presented by bars and blue line, respectively. (e) Spatial intensity maps of four selected genes Orc2, Cdh13, S13gal4, Pvt1 overlain on brightfield image of tissues section. (f) Spatial intensity plot of top three sgRNA hits revealed by Perturb-DBiT overlain on H&E image of tissue section. (g) Left: ligand-receptor interactions within each of the 6 clusters elucidated by unsupervised clustering of gene expression data. Right: spatial maps of four significant ligand-receptor interaction analyses. (h) CODEX staining (26 marker panel) is performed on the adjacent tissue section. Left: Pan B cell markers (Cd19, IgM, and IgD), tumor-specific markers (GFP, Ki67, and PD-L1) and vasculature (Cd31). Middle panel, top: background of GFP-positive (tumor) cells and T cells (Cd3+, Cd4+ helper T cells and Cd3+ Cd8a+ cytotoxic T cells). Middle panel, bottom: Tumor cells showing positivity for Pd-l1. Top right: zoomed in image with green circle representing infiltrating region of Cd8+ T-cells and the tumor. Bottom right: zoomed in image with yellow line representing the border of spatial transcriptomics cluster 1 and cluster 2 within the tumor region. (i) UMAP clustering of the CODEX data revealed 17 distinct protein clusters. (j) Heatmap showing the top differentially expressed proteins for each cluster.

References

    1. Meng X. et al. Assembloid CRISPR screens reveal impact of disease genes in human neurodevelopment. Nature 622, 359–366, doi:10.1038/s41586-023-06564-w (2023). - DOI - PMC - PubMed
    1. Jin X. et al. In vivo Perturb-Seq reveals neuronal and glial abnormalities associated with autism risk genes. Science 370, doi:10.1126/science.aaz6063 (2020). - DOI - PMC - PubMed
    1. Borrelli C. et al. In vivo interaction screening reveals liver-derived constraints to metastasis. Nature 632, 411–418, doi:10.1038/s41586-024-07715-3 (2024). - DOI - PMC - PubMed
    1. Shi H., Doench J. G. & Chi H. CRISPR screens for functional interrogation of immunity. Nat Rev Immunol 23, 363–380, doi:10.1038/s41577-022-00802-4 (2023). - DOI - PubMed
    1. Yin H. et al. Ultrasound-Controlled CRISPR/Cas9 System Augments Sonodynamic Therapy of Hepatocellular Carcinoma. ACS Cent Sci 7, 2049–2062, doi:10.1021/acscentsci.1c01143 (2021). - DOI - PMC - PubMed

Publication types

LinkOut - more resources