[Preprint]. 2025 May 6:rs.3.rs-6443303.
doi: 10.21203/rs.3.rs-6443303/v1.

IBDome: An integrated molecular, histopathological, and clinical atlas of inflammatory bowel diseases

Affiliations

IBDome: An integrated molecular, histopathological, and clinical atlas of inflammatory bowel diseases

Zlatko Trajanoski et al. Res Sq. .

Abstract

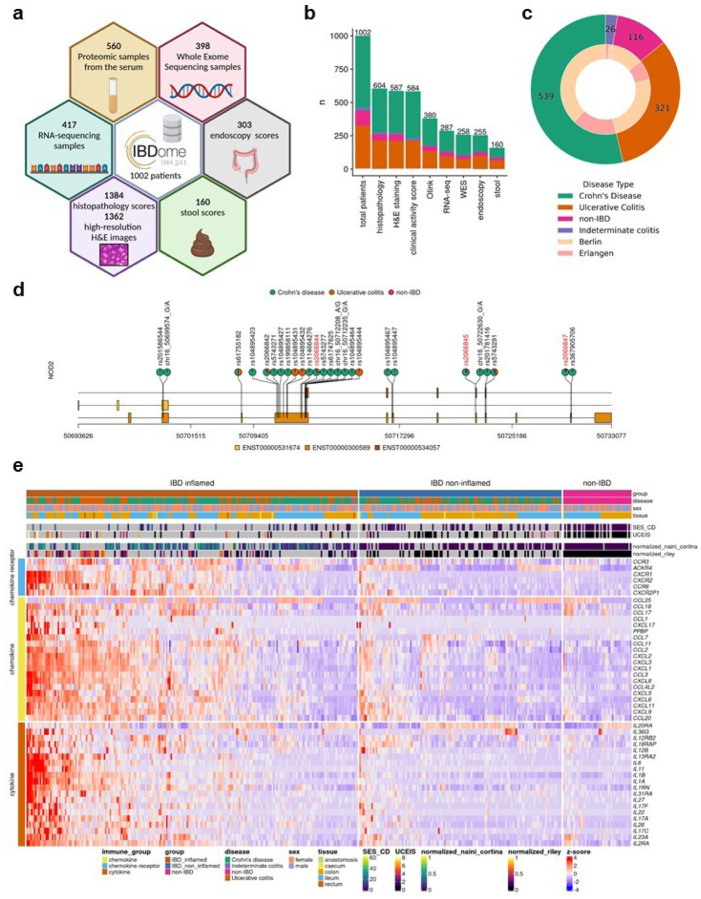
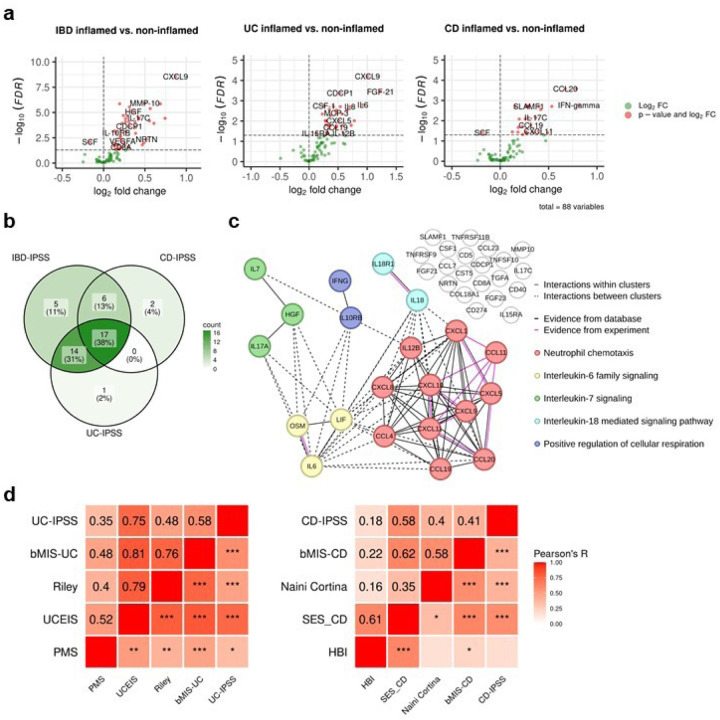
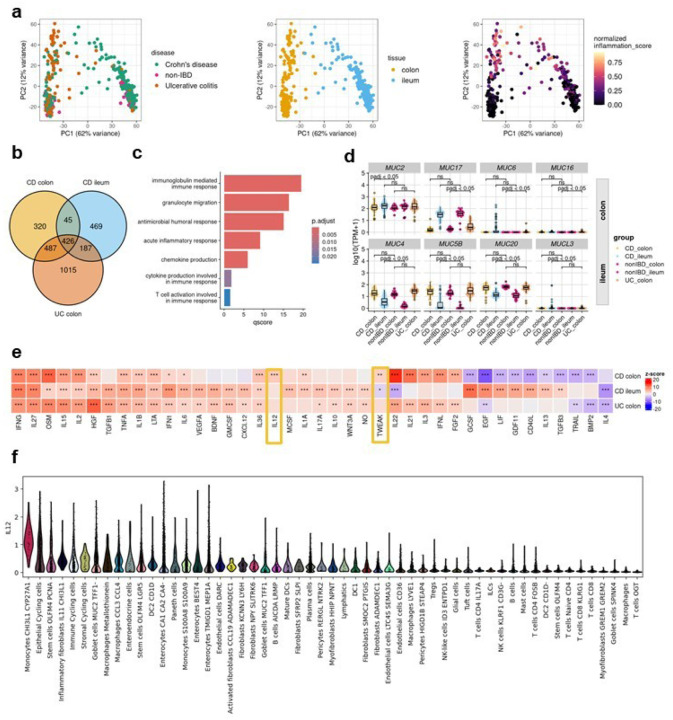
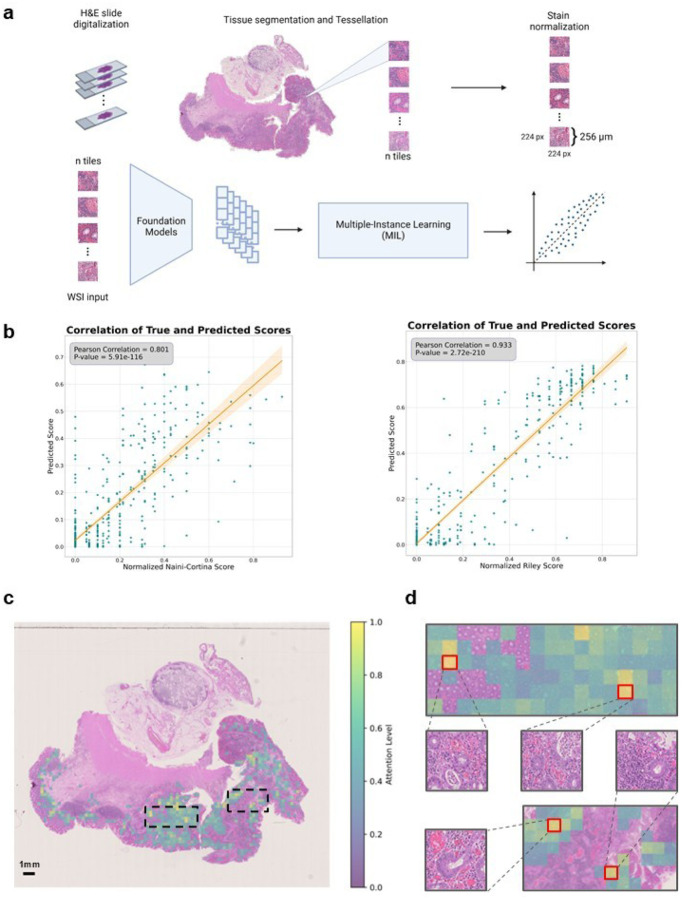
Multi-omic and multimodal datasets with detailed clinical annotations offer significant potential to advance our understanding of inflammatory bowel diseases (IBD), refine diagnostics, and enable personalized therapeutic strategies. In this multi-cohort study, we performed an extensive multi-omic and multimodal analysis of 1,002 clinically annotated patients with IBD and non-IBD controls, incorporating whole-exome and RNA sequencing of normal and inflamed gut tissues, serum proteomics, and histopathological assessments from images of H&E-stained tissue sections. Transcriptomic profiles of normal and inflamed tissues revealed distinct site-specific inflammatory signatures in Crohn's disease (CD) and ulcerative colitis (UC). Leveraging serum proteomics, we developed an inflammatory protein severity signature that reflects underlying intestinal molecular inflammation. Furthermore, foundation model-based deep learning accurately predicted histologic disease activity scores from images of H&Estained intestinal tissue sections, offering a robust tool for clinical evaluation. Our integrative analysis highlights the potential of combining multi-omics and advanced computational approaches to improve our understanding and management of IBD.


Conflict of interest statement

R.A. has served as a speaker, or consultant, or received research grants from AbbVie, Abivax, AlfaSigma, AstraZeneca, Bristol-Myers Squibb, CED Service GmbH, Celltrion Healthcare, Dr Falk Pharma, Galapagos, Johnson & Johnson, Eli Lilly, Materia Prima, MSD, Pfizer, and Takeda Pharma. J.N.K. declares consulting services for Bioptimus, France; Panakeia, UK; AstraZeneca, UK; and MultiplexDx, Slovakia. Furthermore, he holds shares in StratifAI, Germany, Synagen, Germany, Ignition Lab, Germany; has received an institutional research grant by GSK; and has received honoraria by AstraZeneca, Bayer, Daiichi Sankyo, Eisai, Janssen, Merck, MSD, BMS, Roche, Pfizer, and Fresenius. B.S. consulted for AbbVie, Abivax, Boehringer Ingelheim, Bristol Myers Squibb, Dr. Falk Pharma, Eli Lilly, Endpoint Health, Falk, Galapagos, Gilead, Janssen, Landos, Lilly, Materia Prima, PredictImmune, Pfizer, and Takeda; received speaker fees from AbbVie, AlfaSigma, BMS, CED Service GmbH, Dr. Falk Pharma, Eli Lilly, MSD, Ferring, Galapagos, Janssen, Pfizer, and Takeda; and received grant support from Pfizer (all the money went to an institutional account at Charité). All other authors declare no competing interests.

Figures

Figure 1
Figure 1. Characteristics of the IBDome atlas.
a,Schematic overview of the datasets and sample numbers for the 1002 patients integrated in IBDome. b, Number of patients per sample type; colors are representing the different diseases and numbers on top of the graphs are depicting the total numbers. c, Patient distribution illustrated as a nested pie chart, with the outer circle representing the number of patients per disease and the inner circle indicating the proportion of patients per study center (Berlin and Erlangen).d,Exome mutation map of NOD2; highlighted in red are the known most frequent variants R702W (rs2066844), G908R (rs2066845), and 1007fs (rs2066847). e, Heatmap of differentially expressed cytokines, chemokines, and chemokine receptors between IBD inflamed samples (n=223) versus non-IBD controls (n=46), clustered by euclidean distance and complete linkage. SES-CD = Simple Endoscopic Score for Crohn’s Disease; UCEIS = Ulcerative Colitis Endoscopic Index of Severity.
Figure 2
Figure 2. Inflammatory protein severity signature (IPSS).
a, Volcano plots of differentially abundant serum proteins in IBD-inflamed vs. non-inflamed, UC inflamed vs. non-inflamed and CD inflamed vs. non-inflamed samples assessed by Welch t-test with an adjusted p-value <0.1. b, Overlap of proteins in the different inflammatory protein severity signatures. c, Protein-protein interaction network of the serum proteins of the IBD-IPSS. d, Pearson correlation of the inflammatory protein severity signatures with biopsy molecular inflammation scores (bMIS-UC and bMIS-CD) derived from gene set variation analysis from RNA-seq data, histopathology scores (normalized modified Riley score and normalized modified Naini-Cortina score), endoscopic scores (UCEIS = Ulcerative Colitis Endoscopic Index of Severity, SES-CD = Simple Endoscopic Score for Crohn’s Disease) and clinical activity scores (PMS= Partial Mayo Score, HBI=Harvey-Bradshaw Index) for UC and CD, respectively; *** p<0.001, ** p<0.01, * p< 0.05;
Figure 3
Figure 3. Tissue-disease-specific inflammatory gene signatures.
a, Principal component analysis of gene expression data, colored by disease type, tissue and normalized inflammation as assessed by histopathology (normalized modified Naini Cortina score or normalized modified Riley score). b, Venndiagram depicting the overlap of DE genes in the different comparisons (CD inflamed colon vs. non-IBD colon; CD inflamed ileum vs. non-IBD ileum and UC inflamed colon vs. non-IBD colon). c, Commonly upregulated GO-BP terms across all groups. d,Expression [log10(TPM+1)] of significantly upregulated MUCINs detected by DE analysis; adjusted p-values were derived from the DE analysis with DESeq2. e,Cytokine signaling activities in the different groups inferred with CytoSig; z-scores and p-values were derived with the CytoSig permutation test (more details in methods); * FDR < 0.1, ** FDR < 0.05 and *** FDR < 0.01. f, IL12 signaling activity in different cell types of inflamed CD samples (dataset from Kong et al. Immunity2023).
Figure 4
Figure 4. Multi-omics profiling identifies potential serum protein biomarkers for disease localization in IBD.
a, Volcano plots displaying differentially abundant proteins in inflamed, disease-site-specific groups compared to non-IBD controls. Statistical significance was determined using Welch’s t-test with Benjamini-Hochberg correction (FDR < 0.1).b, Venn diagram illustrating the overlap of significantly differentially abundant proteins among CD colon, CD ileum, and UC colon, relative to non-IBD controls. c, Dot plot showing Pearson correlation coefficients (R) between serum protein abundance and histopathology scores (modified Riley score for UC, modified Naini Cortina score for CD) across the three subgroups. Highlighted are uniquely identified differentially abundant proteins from a and b. Significance threshold: adjusted p-value < 0.01. d, Heatmap of Pearson correlation coefficients between serum protein abundance and tissue gene expression in the different groups; * adjusted p-value < 0.05. e, Potential serum proteins associated with colonic disease, UC, and CD that significantly correlate with histopathology scores and, with the exception of IFN-gamma, also with tissue gene expression.
Figure 5
Figure 5. Prediction of histologic disease activity from pathology images.
a, Overview of the image preprocessing pipeline and tile-level feature extraction, utilizing four Foundation models (CHIEF, UNI2, Virchow2 and H-optimus-0) to generate a feature matrix for each patient. An attention-based multiple instance learning (attMIL) architecture is then applied to the extracted features to predict histologic disease activity scores. b, Correlation plots between the original histologic disease activity scores (x-axis) and AI-predicted scores (y-axis) for both Modified Naini Cortina and Modified Riley scoring systems, based on 5-fold cross-validation on the Berlin subset using the best performing Foundation Model (UNI2 and Virchow2 respectively). c, Representative attention heatmap of a WSI from a UC patient with high histologic disease activity. The heatmap shows the model’s attention levels, displaying only tiles with scores above 0.4. Higher scores (yellow) mark regions that strongly influence the model’s prediction, while lower scores (green) indicate less critical regions. d, Zoomed-in view of the highest-attention regions highlighted in c, showing 4 of the top 10 attention tiles, outlined in red

References

    1. Le Berre C., Ananthakrishnan A. N., Danese S., Singh S. & Peyrin-Biroulet L. Ulcerative Colitis and Crohn’s Disease Have Similar Burden and Goals for Treatment. Clin. Gastroenterol. Hepatol. 18, 14–23 (2020). - PubMed
    1. Sato Y. et al. Inflammatory Bowel Disease and Colorectal Cancer: Epidemiology, Etiology, Surveillance, and Management. Cancers 15, 4154 (2023). - PMC - PubMed
    1. Wilson J. C., Furlano R. I., Jick S. S. & Meier C. R. Inflammatory Bowel Disease and the Risk of Autoimmune Diseases. J. Crohns Colitis 10, 186–193 (2016). - PubMed
    1. Wang R., Li Z., Liu S. & Zhang D. Global, regional and national burden of inflammatory bowel disease in 204 countries and territories from 1990 to 2019: a systematic analysis based on the Global Burden of Disease Study 2019. BMJ Open 13, e065186 (2023). - PMC - PubMed
    1. Dolinger M., Torres J. & Vermeire S. Crohn’s disease. Lancet Lond. Engl. 403, 1177–1191 (2024). - PubMed

Publication types

LinkOut - more resources