. 2025 Apr 23;10(3):887-896.
doi: 10.1016/j.synbio.2025.04.011. eCollection 2025 Sep.

Ty retrotransposon element based multiple integration toolkit for Saccharomyces cerevisiae

Affiliations

Ty retrotransposon element based multiple integration toolkit for Saccharomyces cerevisiae

Song Gao et al. Synth Syst Biotechnol. .

Abstract

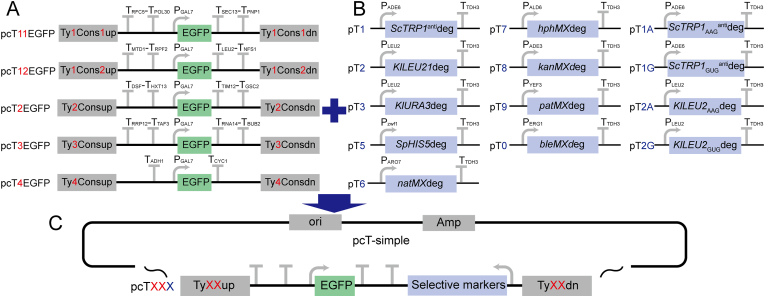
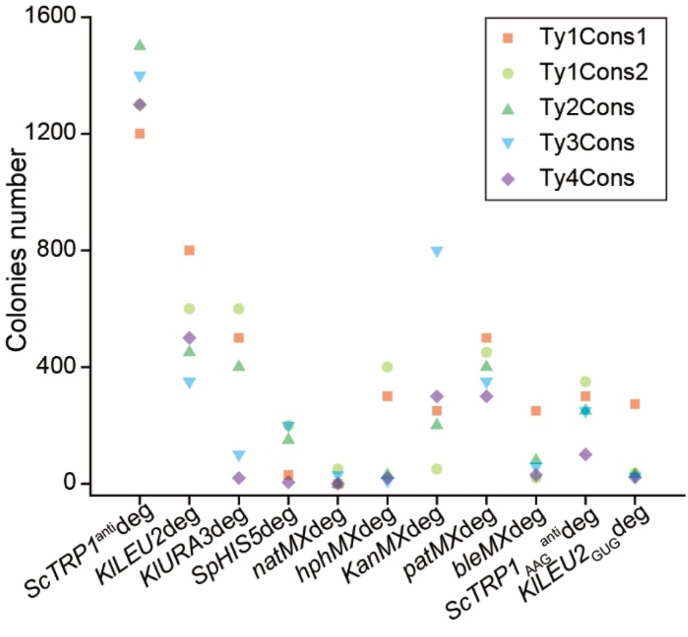
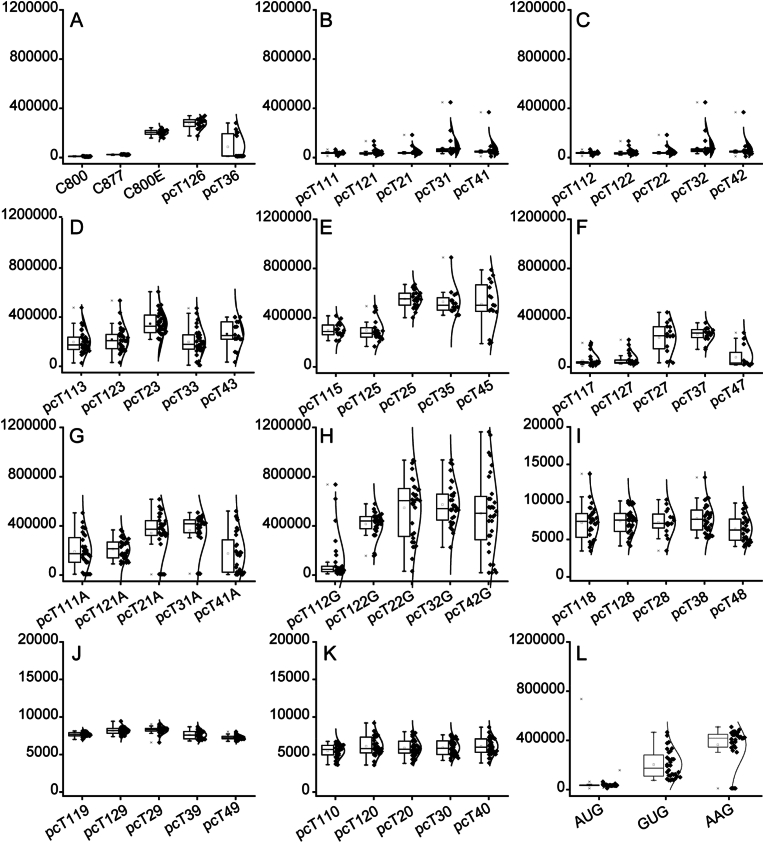
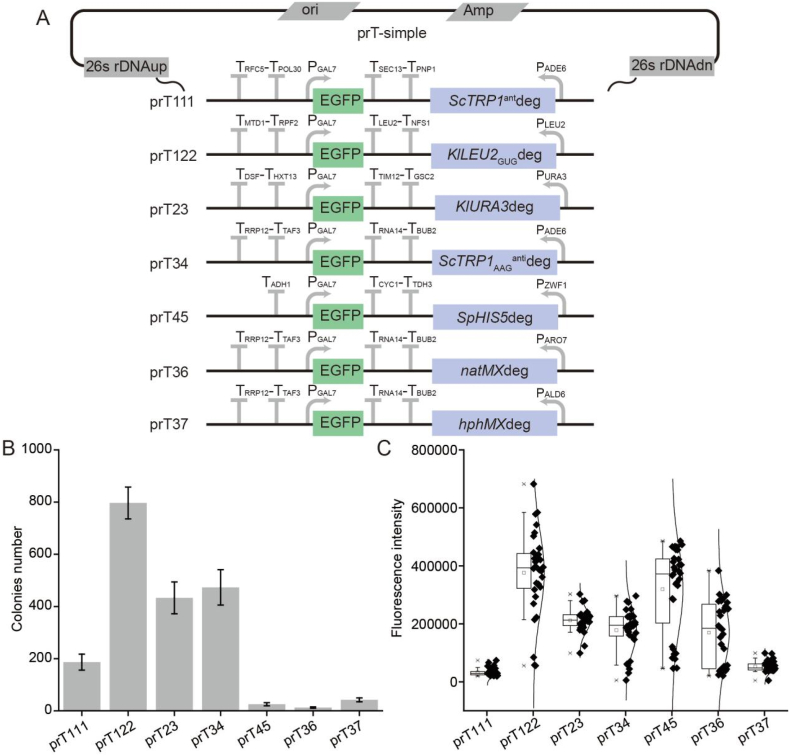
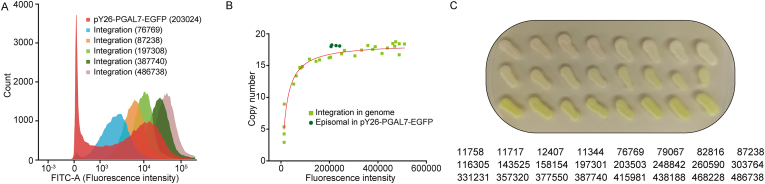
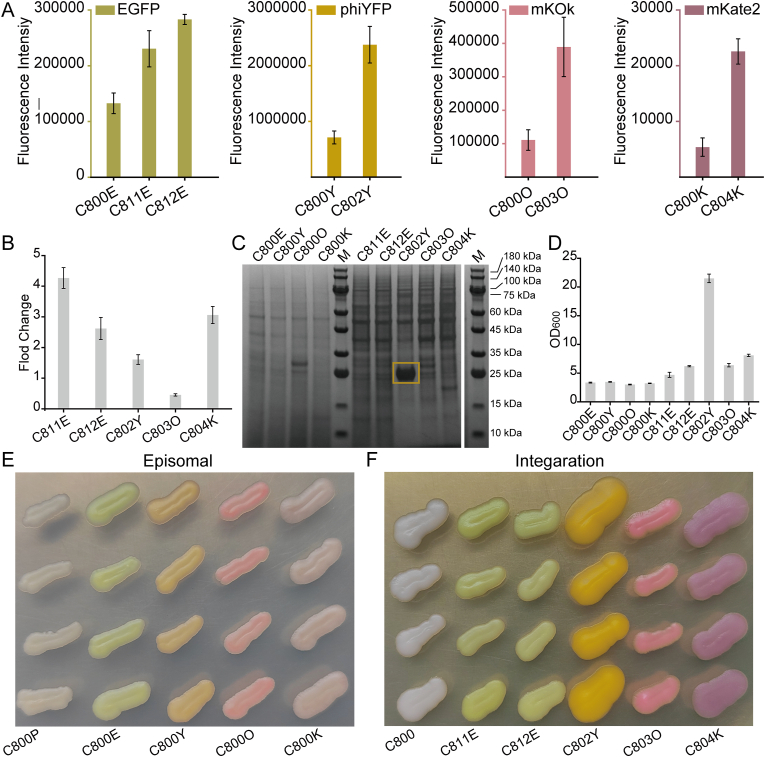
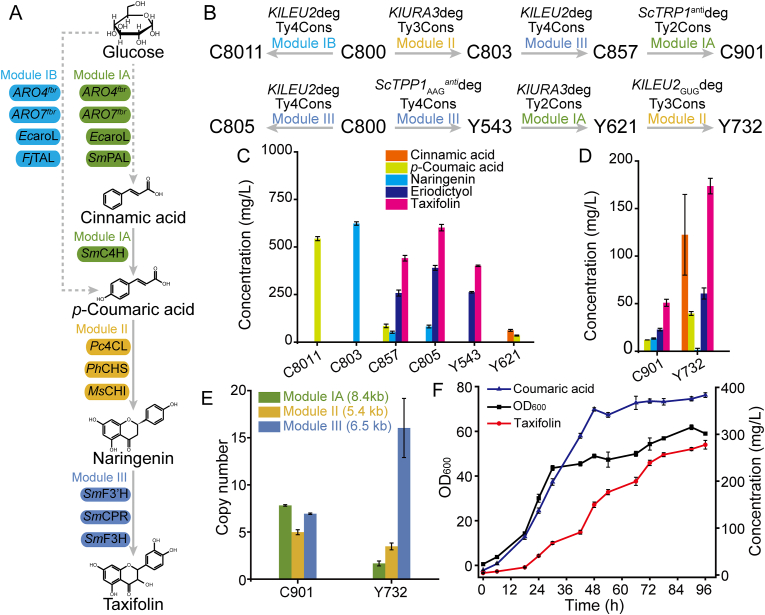
Extra-high-level overexpression of single or multiple specific proteins by integrating specific genes in the genome is vital to achieve the stable and efficient production of target proteins and metabolites in S. cerevisiae. Five families of Ty elements in the genome of S. cerevisiae CEN.PK2-1D, which could have dozens to hundreds of copies, have been employed to achieve massive gene expression. By engineering nine selective markers, six of them (TRP1, LEU2, URA3, HIS5, natMX and hphMX) achieve stably high copy integration (>15 copies) at Ty sites. Fluorescence proteins and taxifolin biosynthesis pathway genes were overexpressed to verify the toolkit. The titer of protein phiYFP in the multiple integration strain reached 1.6 g/L (268.1 mg/g DCW), and its fluorescence intensity was 3.3 times higher than that in the episomal overexpression strain. For taxifolin biosynthesis, 14 genes were integrated into three different Ty sites using three selective markers from the toolkit, resulting in 277.6 mg/L taxifolin accumulation from glucose.

Keywords: Gene overexpression; High copy number integration; Metabolic engineering; Protein production; Retrotransposons.


Conflict of interest statement

The authors declare that they have no competing interests.

Figures

Fig. 1
Fig. 1
Characteristics of the multiple integration toolkit. A: The characteristics of the integration plasmid skeletons without selective markers. B: The characteristics of selective markers. C: The characteristics of the multiple integration plasmid used. The Xs indicate the plasmid number.
Fig. 2
Fig. 2
Distribution of colony numbers after a single transformation. Different selective markers have different colony distributions after a single transformation.
Fig. 3
Fig. 3
Distribution of the fluorescence intensity of colonies. The Y-axis is fluorescence intensity (The cell density of OD600 was up to 5.0). A: C800 is the initial strain without EGFP. C877 has one copy of EGFP in the genome. Strain C800E is C800 with the plasmid pY26-PGAL7-EGFP. The pcT126 and pcT36 are the EGFP expression boxes that were integrated into the C800 genome at Ty1Cons2 and Ty3Cons sites under natMXdeg selective markers. B–K: Distribution of fluorescence intensity in colonies with five Ty sites under selective markers ScTRP1antideg, KlLEU2deg, KlURA3deg, SpHIS5deg, hphMXdeg, ScTRP1AAGantideg, KlLEU2GUGdeg, KanMXdeg, patMXdeg and bleMXdeg. L: Distribution of fluorescence intensity in colonies when selective marker ScTRP1antideg was under the initial codons AUG, GUG and AAG.
Fig. 4
Fig. 4
Application at the 26s rDNA site. A: The characteristics of plasmid skeletons with selective markers at 26s rDNA sites. B: The distribution of colony numbers after a single transformation. C: The fluorescence intensity distribution of the colonies.
Fig. 5
Fig. 5
The relationship between fluorescence intensity and copy numbers. A: Distribution of the fluorescence intensity of integration strains and episomal strains analyzed by FACS. B: Distribution of the copy number of integration strains and episomal strains under different fluorescence intensity. The fluorescence intensity numbers are calculated by using a microplate reader (under 48-deep-well plate cultivation). C: The colour of integration colonies. The numbers beside the colonies are fluorescence intensity values calculated by a microplate reader (under 48-deep-well plate cultivation).
Fig. 6
Fig. 6
Protein overexpression assay. The fluorescence proteins EGFP, phiYFP, mKOk and mKate2 were overexpressed by using the multiple integration toolkit. A: The fluorescence intensity of episomal strains and integration strains (under shake flask cultivation). B: The fold change of genes in integration strains compared with episomal strains. C: The SDS-PAGE of episomal strains and integration strains. The phiYFP protein accumulation in the integration strain is marked with a yellow box. D: The cell density of episomal strains and integration strains for fluorescence protein production. E: The phenotype of episomal strains. F: The phenotype of integration strains.
Fig. 7
Fig. 7
Pathway genes overexpression assay. A: Taxifolin biosynthesis pathway-related genes. B: Pathway gene integration process and strain construction process. C: Chemical production of intermediate strains. D: Chemical production of de novo strains. E: Gene copy numbers in de novo strains and the length of the expression box. F: Fed-batch fermentation of strain Y732.

Similar articles

References

    1. Li X.L., Zhou Z., Li W.N., Yan Y.J., Shen X.L., Wang J., Sun X.X., Yuan Q.P. Design of stable and self-regulated microbial consortia for chemical synthesis. Nat Commun. 2022;13(1):1554. doi: 10.1038/s41467-022-29215-6. - DOI - PMC - PubMed
    1. Huang M.T., Wang G.K., Qin J.F., Petranovic D., Nielsen J. Engineering the protein secretory pathway of Saccharomyces cerevisiae enables improved protein production. Proc Natl Acad Sci U S A. 2018;115(47):E11025–E11032. doi: 10.1073/pnas.1809921115. - DOI - PMC - PubMed
    1. Schultz C., Lian J.Z., Zhao H.M. Metabolic engineering of Saccharomyces cerevisiae using a trifunctional CRISPR/Cas system for simultaneous gene activation, interference, and deletion. Methods Enzymol. 2018;608:265–276. doi: 10.1016/bs.mie.2018.04.010. - DOI - PubMed
    1. Gilon T., Chomsky O., Kulka R.G. Degradation signals for ubiquitin system proteolysis in Saccharomyces cerevisiae. EMBO J. 1998;17(10):2759–2766. doi: 10.1093/emboj/17.10.2759. - DOI - PMC - PubMed
    1. Gao S., Lyu Y.B., Zeng W.Z., Du G.C., Zhou J.W., Chen J. Efficient biosynthesis of (2S)-naringenin from p-coumaric acid in Saccharomyces cerevisiae. J Agric Food Chem. 2020;68(4):1015–1021. doi: 10.1021/acs.jafc.9b05218. - DOI - PubMed

LinkOut - more resources