

A comparison of SWATH-MS methods for measurement of residual host cell proteins in adeno-associated virus preparations
- PMID: 40386465
- PMCID: PMC12081442
- DOI: 10.3389/fbioe.2025.1579098
A comparison of SWATH-MS methods for measurement of residual host cell proteins in adeno-associated virus preparations
Abstract
Introduction: Analysis of residual host cell proteins in adeno-associated virus (AAV) preparations is challenging due to low availability and high complexity of samples. One strategy to address these challenges is through development of improved liquid chromatography-tandem mass spectrometry (LC-MS/MS) methods with greater sensitivity and reduced sample requirement.
Methods: In this work, we compare the performance of four sequential window acquisition of all theoretical fragment ion mass spectra (SWATH-MS) methods for identification and quantitation of residual HCPs in rAAV2, -5, -8, and -9 preparations produced with human embryonic kidney 293 (HEK293) cells and purified using immunoaffinity chromatography. Key SWATH-MS parameters including spectral library construction (data dependent vs. in silico), data processing software (DIA-NN vs. Skyline), and mass spectrometer instrument (Sciex TripleTOF 6600 vs. Sciex ZenoTOF 7600) were assessed. Method attributes including sample requirement and processing time, and method outputs including protein and precursor identifications, host cell protein quantitation comparisons across methods, and quantitation coefficients of variance (CV) were considered to help establish a SWATH-MS workflow well-suited for rAAV HCP analytics.
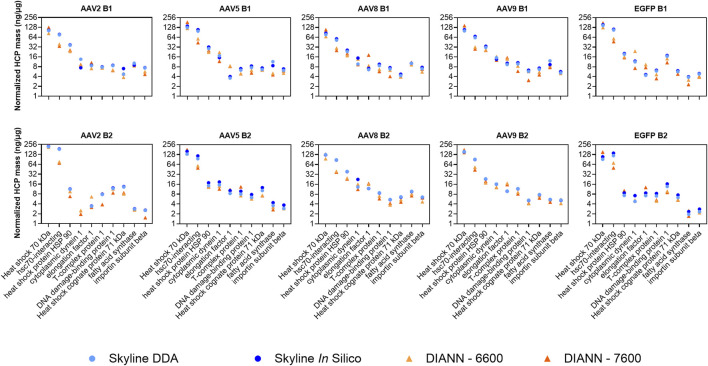
Results: A 78% increase in HCP identifications, 80% reduction in sample requirement, and 70% reduction in instrument runtime was achieved with an in silico spectral library, data processing in DIA-NN, and data collection with the Sciex ZenoTOF 7600 instrument (DIA-NN-7600 method) compared to a previously established method using a DDA-derived spectral library, data processing in Skyline, and data collection with the Sciex TripleTOF 6600 instrument (Skyline-DDA-6600 method). Additionally, the DIA-NN-7600 method shows median HCP quantitation CV below 10% for triplicate data acquisitions, and comparable quantitation to other methods for a panel of highly abundant residual HCPs previously identified in rAAV downstream processing.
Discussion: This work highlights a SWATH-MS method with data collection and processing specifically tailored for rAAV residual HCP analysis.
Keywords: DIA-NN; SWATH-MS; adeno-associated virus (AAV); data independent acquisition (DIA); host cell proteins (HCPs); liquid chromatography-tandem mass spectrometry (LC-MS/MS); mass spectrometry.
Copyright © 2025 Leibiger, Min and Lee.
Conflict of interest statement
The authors declare that the research was conducted in the absence of any commercial or financial relationships that could be construed as a potential conflict of interest.
Figures


References
-
- Carvalho S., Profit L., Krishnan S., Gomes R., Alexandre B., Clavier S., et al. (2024). SWATH-MS as a strategy for CHO host cell protein identification and quantification supporting the characterization of mAb purification platforms. J. Biotechnol. 384, 1–11. Article. 10.1016/j.jbiotec.2024.02.001 - DOI - PubMed
-
- Chiu J., Valente K. N., Levy N. E., Min L., Lenhoff A. M., Lee K. H. (2017). Knockout of a difficult-to-remove CHO host cell protein, lipoprotein lipase, for improved polysorbate stability in monoclonal antibody formulations. Biotechnol. Bioeng. 114 (5), 1006–1015. 10.1002/bit.26237 - DOI - PMC - PubMed
LinkOut - more resources
Full Text Sources
Miscellaneous