

Dietary Variability Among Mountain Gorilla Groups Across Volcanoes National Park, Rwanda
- PMID: 40386491
- PMCID: PMC12081832
- DOI: 10.1002/ece3.71192
Dietary Variability Among Mountain Gorilla Groups Across Volcanoes National Park, Rwanda
Abstract
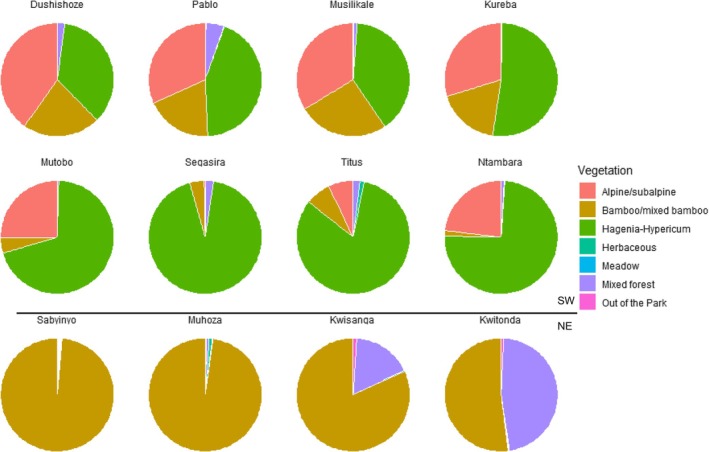
Gaining a more complete understanding of a species' dietary variability is crucial to properly discern distribution, population growth trends, and conservation actions. Endangered mountain gorillas live in topographically complex forests covering a wide elevational range and diverse habitat matrices. Since 1967, mountain gorillas have been studied at high elevations in the southwest of the Volcanoes National Park (VNP) in Rwanda, where groups use different compositions of habitats and have been growing at higher rates than groups in the northeast VNP region, which is characterized by lower elevations. Building on previous efforts, we describe dietary variability among VNP mountain gorilla groups by integrating data from groups ranging in the northeast VNP. We assessed and compared nutritional components of key foods (making up 80% of the diet) to better understand whether variation in diet quality could be linked to within-population growth differences. Feeding and ranging data were collected between November 2019 and December 2022, using long-term monitoring data, group scans, and focal animal sampling. To compare diet quality, we combined nutritional values from newly collected food plants and previously collected and assessed food plant samples using comparable field and laboratory methods. We recorded 57 new foods for the study population. Groups in the southwest (N = 8) and the northeast (N = 4) regions of VNP used different vegetation zones, and there was high dietary variability with low diet overlap among these regions. Although northeast groups rely on more diverse diets, key foods (making up ~80% of the diet) had comparable nutrient concentrations to southwest groups. This suggests that diet quality is unlikely to be a main driver of observed heterogeneous population growth. For follow-up research, we discuss alternative explanations linked to food distribution, biomass, and energy expenditure to access foods. Our findings add important information for future habitat suitability assessments essential for mountain gorilla conservation management and habitat restoration and expansion efforts.
Keywords: diet diversity; diet overlap; dietary evenness; food plant nutrition; habitat use; park restoration.
© 2025 Dian Fossey Gorilla Fund, Max Planck Institute for Evolutionary Anthropology and The Author(s). Ecology and Evolution published by British Ecological Society and John Wiley & Sons Ltd.
Conflict of interest statement
The authors declare no conflicts of interest.
Figures


References
-
- Akayezu, P. , van Duren I. C., Groen T. A., Grueter C. C., and Robbins M. M.. 2019. “Abundance and Spatial Distribution of the Main Food Species for Mountain Gorillas in the Virunga Massif, Rwanda.” Biodiversity and Conservation 28, no. 13: 3597–3620. 10.1007/s10531-019-01838-0. - DOI
-
- Altmann, J. 1974. “Observational Study of Behavior: Sampling Methods.” Behaviour 49: 227–265. - PubMed
-
- Belyea, L. R. , and Lancaster J.. 1999. “Assembly Rules Within a Contingent Ecology.” Oikos 86, no. 3: 402–416. 10.2307/3546646. - DOI
LinkOut - more resources
Full Text Sources
