. 2025 May 15;8(2):e70073.
doi: 10.1002/jsp2.70073. eCollection 2025 Jun.

An Extracellular Matrix Hydrogel Restores Disc Volume and Alleviates Axial Hypersensitivity in a Rat Model of Disc-Associated Pain

Affiliations

An Extracellular Matrix Hydrogel Restores Disc Volume and Alleviates Axial Hypersensitivity in a Rat Model of Disc-Associated Pain

David J Lillyman et al. JOR Spine. .

Abstract

Background: Chronic low back pain is a global socioeconomic crisis, and the majority of those treated for this condition fail to reach long-term remission. Intervertebral disc degeneration is the predominant associative factor in chronic low back pain. Degenerated discs present with mechanical instability, inflammation, and nerve sprouting. Patients treated with spinal stabilizing procedures often report pain alleviation indicating aberrant spinal mechanics, could be causative in the production of pain.

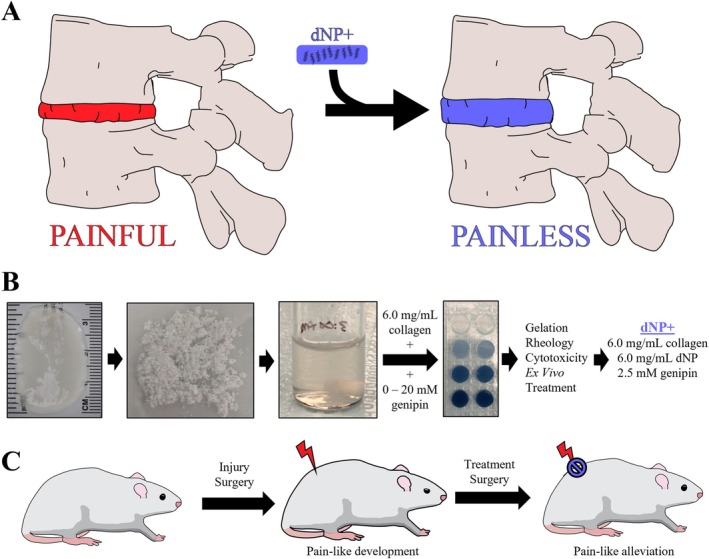
Methods: With this knowledge, a therapeutic was engineered from decellularized healthy porcine nucleus pulposus tissue mixed with type I collagen and a chemical crosslinker, genipin, to treat mechanical instability and pain.

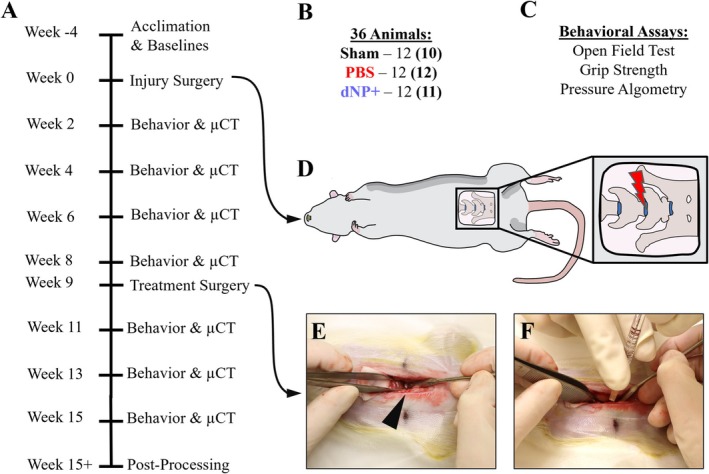
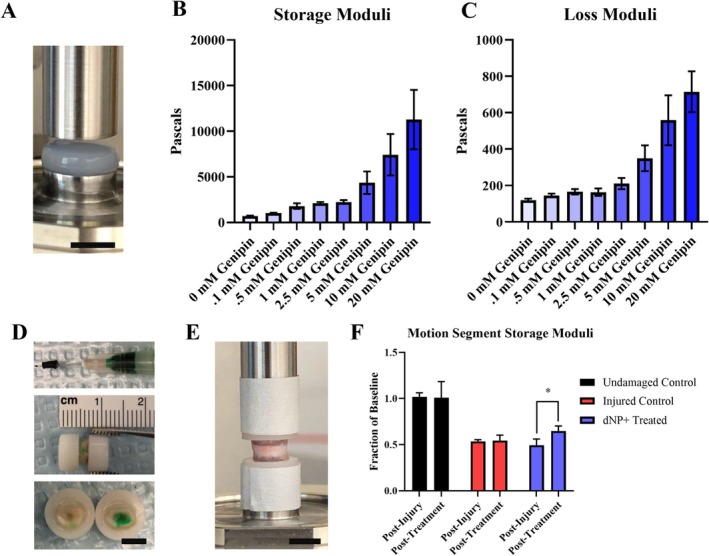
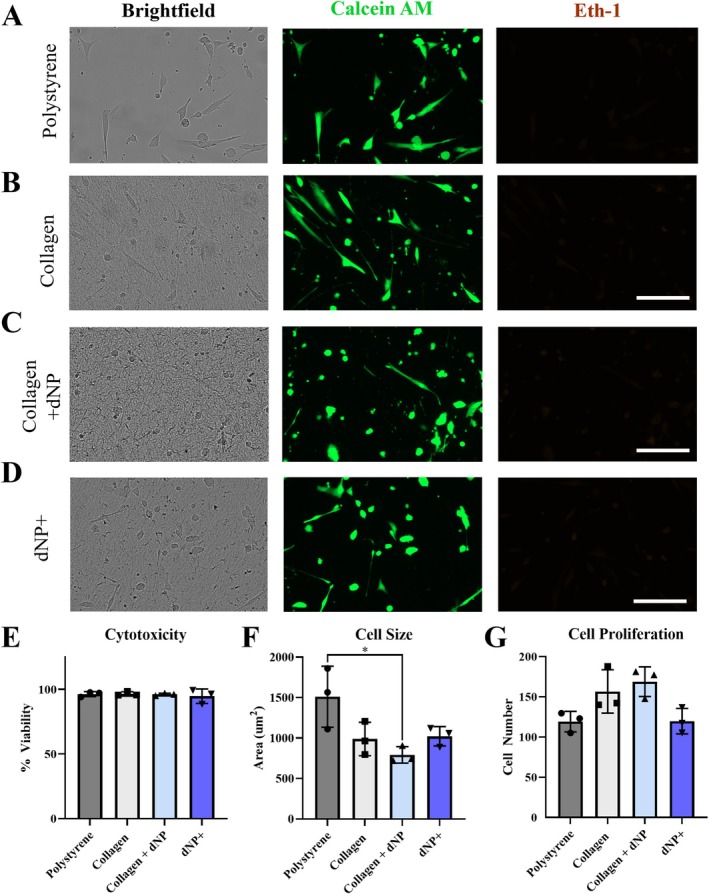
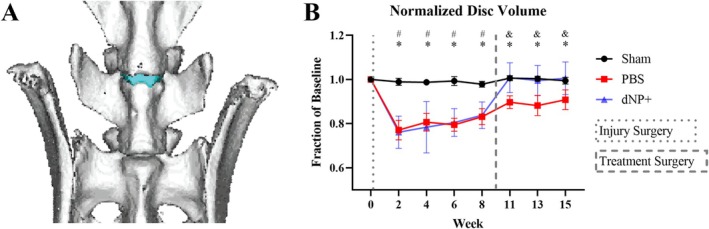
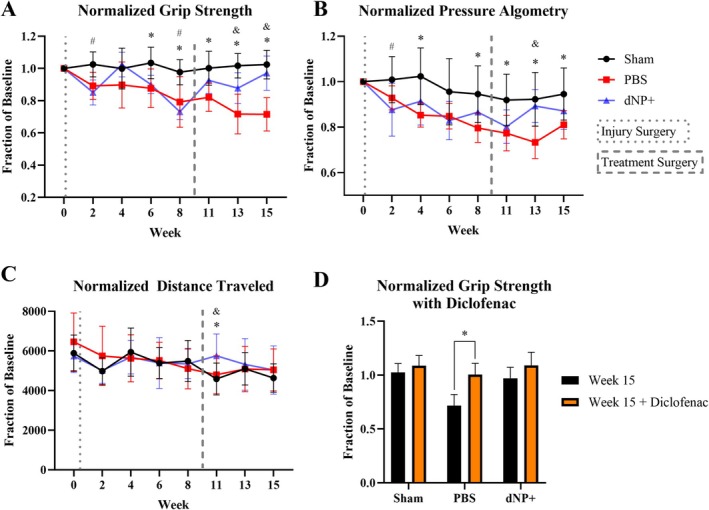
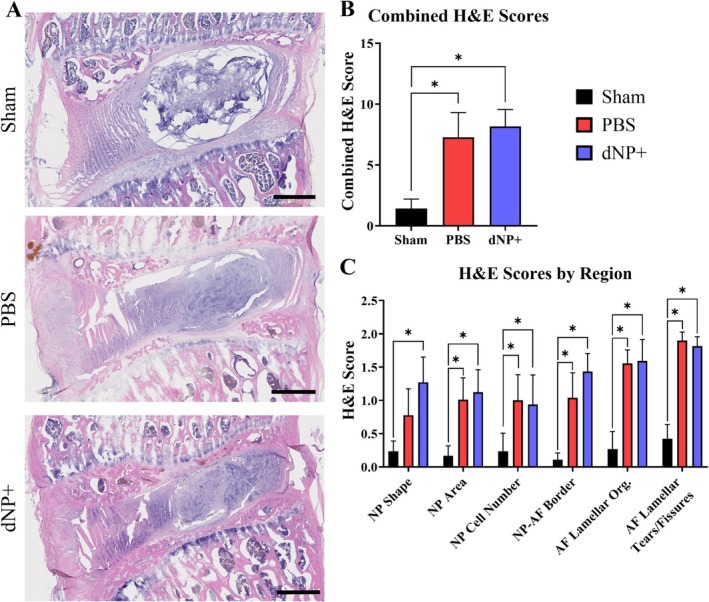
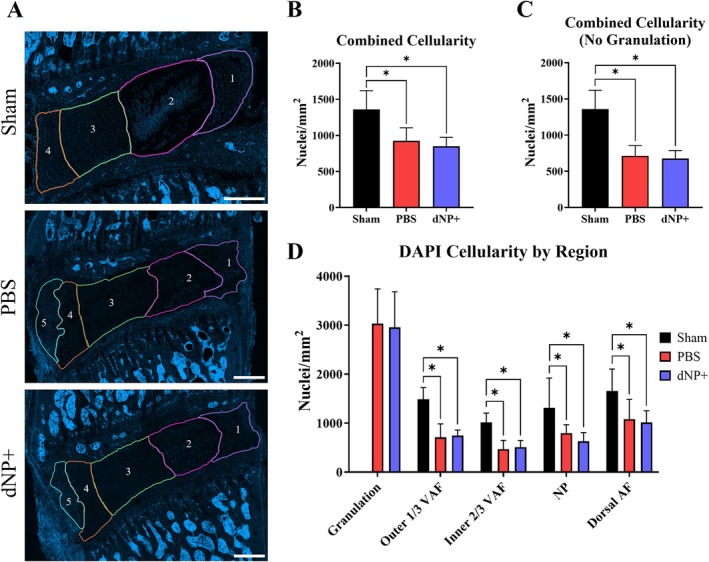
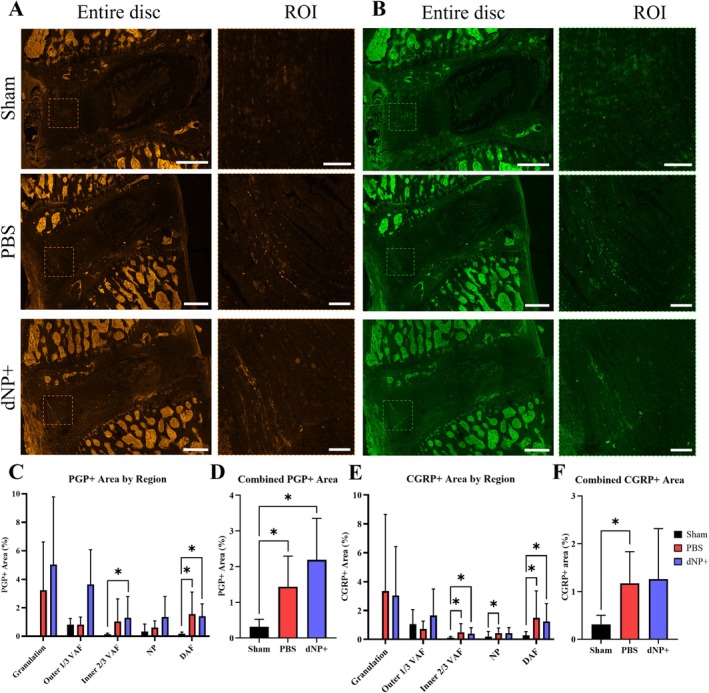
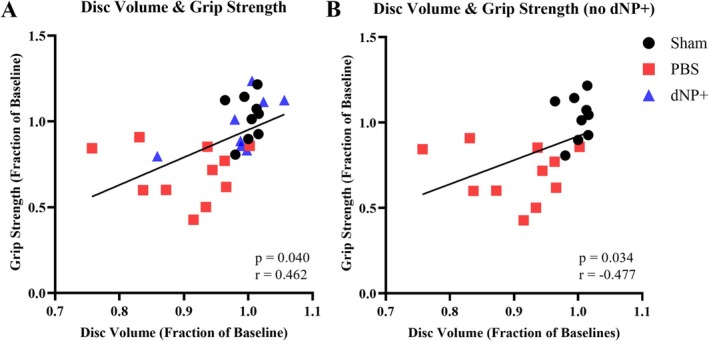
Results: In vitro, this hydrogel, termed dNP+, was spontaneously fibrillogenic at 37°C and cytocompatible with primary human disc cells and exhibited the capacity to improve the intervertebral disc storage modulus after injury. In vivo, in a rat model of discogenic low back pain, dNP+ proved effective at restoring degenerated disc volume, decreasing axial hypersensitivity, and decreasing spontaneous pain-like behavior when administered 9 weeks after disc degeneration was initiated. However, dNP+ did not alter nerve presence or restore disc morphology when compared to injured discs.

Conclusion: Conclusion: Altogether, the data collected in this study concluded that dNP+ was an effective treatment for pain-like behavior in a robust animal model of chronic disc-associated low back pain.

Keywords: decellularized tissue; disc degeneration; disc‐associated pain; genipin; low back pain.


Conflict of interest statement

David J. Lillyman and Rebecca A. Wachs are currently pursuing a patent application for the dNP+ material, US Patent App. 18/445466.

Figures

FIGURE 1
FIGURE 1
Study overview. (A) The central proposal of this work was that a treatment for disc‐associated pain could be fabricated from a mixture of decellularized healthy porcine NP tissue, collagen, and genipin. This therapeutic would theoretically be tissue integrating, spontaneously fibrillogenic, cytocompatible, and biomechanically restorative, leading to pain‐like behavior remission. (B) The first arm of this work entailed testing decellularized nucleus pulposus gels supplemented with 6.0 mg/mL collagen and genipin from 0 to 20 mM. Testing of these gels (dNPs) included gelation kinetics, rheology, cytotoxicity, and ex vivo capacity to restore injured disc mechanics. (C) The outcomes of the first arm determined that the optimal formulation to test in vivo was 6.0 mg/mL dNP + 6.0 mg/mL collagen +2.5 mM genipin, referred to in this manuscript as dNP+. To test this therapeutic, disc degeneration was induced in female Sprague Dawley rats and allowed to progress for 8 weeks. At 9 weeks post‐injury, half of the injured animals were treated with dNP+ and the other half with 1X PBS. Throughout the in vivo arm, disc volume and pain‐like behavioral metrics were collected to monitor the effects of disc injury and treatment.
FIGURE 2
FIGURE 2
Animal study overview. (A) Timeline of the in vivo assessment of dNP+. Animals were acclimated for 3 weeks before a week of baseline behavior and μCT measurements. Injury surgery was performed on week 0 and disc degeneration was allowed to progress for 8 weeks before treatment surgery on week 9. Following treatment surgery, behavior and μCT measurements were collected for 6 weeks. (B) For this study, 36, 19‐week‐old, female Sprague Dawley rats were split into three groups: Sham, PBS, and dNP+. One sham animal was terminated due to surgical complications and one dNP+ animal was excluded due to incorrect treatment injection. Final animal numbers are shown in bold in parenthesis. (C) Three assays were employed to measure the development and alleviated of pain‐like behavior during the study. The open field test measured spontaneous pain‐like behavior and grip strength and pressure algometry measured evoked pain‐like behavior. (D) Graphical depiction of the injury surgery. The L5‐L6 IVD was approached ventrally and injured using a microdissecting needle. (E) During treatment surgery, the L5‐L6 disc was visualized in all animal groups. The disc can be seen at the tip of the black arrowhead. (F) Animals in the PBS group were injected with 1X PBS and animals in the dNP+ group were injected with dNP+.
FIGURE 3
FIGURE 3
Genipin increases dNP rheological properties and dNP+ increases injured motion segment rheological properties. (A) Image of a dNP hydrogel on the rheometer. Scale bar = 4 mm. (B) Storage moduli of the dNP with various concentrations of genipin. These values represent the elastic resistance to torsional strain. The variability increased dramatically with genipin concentrations greater than 5 mM. (C) Loss moduli of the dNP with various concentrations of genipin. These values represent the viscous resistance to torsional strain. Like the storage moduli, variability increased dramatically when genipin concentrations exceeded 5 mM. (D) Overview of the injection process. In the top image, the 30‐gauge needle is shown with a rubber stopper set at 2 mm from the needle tip. The rubber stopper was fixed to the needle to make injection into the NP space easier. The middle image shows a potted motion segment injected with dNP gel dyed green. Evidence of injection can be seen by the faint green dye on the surface of the annulus fibrosus. In the bottom image, an injected motion segment was transected to display the presence of dyed dNP hydrogel injected in the disc. (E) An image of a potted motion segment fixed to the rheometer. (F) Motion segment storage moduli from undamaged, injured, and dNP+ treated motion segments. The average storage modulus of undamaged control motion segments did not change over the course of the experiment. Injury decreased the average storage modulus by 50%. Treatment with dNP+ significantly rescued the storage modulus by 15% compared to post‐injury. Data are shown as mean with SD (n = 3 per group). * = p < 0.05.
FIGURE 4
FIGURE 4
dNP+ is not cytotoxic. Representative images from the NP cell viability experiments (A–D). NP cells exhibited a more elongated morphology on polystyrene compared to collagen, collagen + dNP, and dNP+ substrates. (E) Quantification of treatment cytotoxicity. All treatments exhibited minimal cytotoxicity, with the lowest average viability occurring in the dNP+ treatment at 94.75%. (F) Quantification of cell size. Cells plated on polystyrene had a significantly larger average area than those plated on collagen + dNP. (G) Quantification of total cell proliferation over the 48 h of culture. No significant differences were detected between any treatment group. The average dNP+ treatment cell count was 66% that of collagen + dNP, but this difference narrowly missed significance (p < 0.052). Data are shown as mean with SD. Experiments consisted of three unique donors plated in triplicate (n = 3). Eth‐1 images brightness‐contrast enhanced for viewing. * = p < 0.05.
FIGURE 5
FIGURE 5
dNP+ restores disc volume. (A) 3D rendering of a rat spine from L5 to S1. The L5‐L6 IVD is colored blue. (B) L5‐L6 intervertebral disc volumes calculated from μCT data. The disc volume in both dNP+ and PBS animals significantly decreased after injury compared to sham animals. After treatment surgery, dNP+ treated animal disc volumes returned to baseline and were no longer significantly different from sham. Data are shown as mean with standard deviation (n = 11–12 per group). # = p < 0.05 sham versus dNP+. * = p < 0.05 sham versus PBS. & = p < 0.05 dNP+ versus PBS.
FIGURE 6
FIGURE 6
dNP+ and diclofenac alleviate axial hypersensitivity. (A) Normalized grip strength data that measured axial hypersensitivity. Both PBS and dNP+ animal groups exhibited significantly decreased grip strength in weeks 6 and 8 compared to sham animals. After treatment surgery, grip strength increased in dNP+ animals and was not significantly different from sham animals for the remainder of the study. The grip strength of PBS animals continued to decline from week 11 onward and was significantly different from sham at all time points post‐treatment surgery. PBS animals also exhibited significantly decreased grip strength compared to dNP+ treated animals at weeks 13 and 15. (B) Normalized pressure algometry that measures deep pressure hypersensitivity. PBS animals exhibited decreased pressure thresholds at weeks 4, 8, 13, and 15 compared to sham animals. Also, PBS animals exhibited lower thresholds compared to dNP+ animals at week 13. At no point did the dNP+ animal group significantly differ from sham animals. (C) Distance traveled was a measure of spontaneous pain‐like behavior. The only significant difference measured was at week 11 between dNP+ animals and sham animals. (D) 15‐week grip strength before and after treating with diclofenac. Diclofenac was effective at suppressing axial hypersensitivity as noted by the highly significant increase in animal grip strength after drug administration in PBS animals. (n = 11–12 per group). For longitudinal data, significant differences between groups were assessed using a two‐way ANOVA. Drug treatment data were analyzed using a one‐way ANOVA. # = p < 0.05 sham versus dNP+. * = p < 0.05 sham versus PBS. & = p < 0.05 dNP+ versus PBS.
FIGURE 7
FIGURE 7
dNP+ does not restore disc morphology. (A) Representative images of L5‐L6 motion segments stained with H&E. Sham discs exhibited large, circular, and highly cellular NPs and AF with organized collagen lamellae. PBS and dNP+ groups showed less cellular and distorted NPs with disrupted and distorted collagen lamellae in the NP (scale bar = 500 μm). (B) Combined H&E scores across all categories. Significant differences were detected between the PBS and sham group and the dNP+ and sham group. (C) H&E scores by category. Significant differences were detected between the PBS and sham group and the dNP+ and sham group in most categories. Three images from each disc were scored and averaged together (sham: N = 10, PBS: N = 11, dNP+ n = 9). H&E category data were analyzed using the Kruskal–Wallis test and Dunn's post hoc test. Combined H&E score data were analyzed using a one‐way ANOVA with Tukey's post hoc test. * = p < 0.05.
FIGURE 8
FIGURE 8
dNP+ maintains disc hypocellularity. (A) Representative images of motion segments stained with DAPI. Regions are as follows: 1 = dorsal AF, 2 = NP, 3 = inner 2/3 ventral AF, 4 = outer 1/3 ventral AF, and 5 = granulation tissue. Sham discs were highly cellular in the NP and AF. PBS and dNP+ discs displayed cell clustering in the NP forming lacunae and less cellularity in the AF, especially along the needle tract. PBS and dNP+ discs also formed highly cellular granulation tissue between the ventral ligament and ventral AF (scale bar = 500 μm). (B) Combined cellularity scores. There was a significant decrease in cellularity between the sham and PBS group and between the sham and dNP+ group. (C) Combined cellularity scores without the inclusion of granulation tissue. There was a significant decrease in cellularity between the sham and PBS group and between the sham and dNP+ group. (D) DAPI cellularity by region. Disc images were manually broken out into groups as described above. There were significant differences in all regions between sham & PBS and sham & dNP+ groups. Three images from each disc were quantified (sham: N = 10, PBS: N = 11, dNP+ n = 9). Cellularity region data were analyzed with the Kruskal–Wallis test and Dunn's post hoc test. Combined cellularity data were analyzed with a one‐way ANOVA with Tukey's post hoc test. * = p < 0.05.
FIGURE 9
FIGURE 9
PBS and dNP+ treatment results in an increase in aberrant nerve growth. (A) Brightness‐enhanced representative images of motion segments stained with PGP9.5. ROIs focus on nerve growth in the ventral AF (VAF). Sham animals display little positivity in the disc region. PBS and dNP+ animals display more positive staining in the disc region compared to sham (entire disc scale bar = 500 μm & ROI scale bar = 100 μm). (B) Representative images of motion segments stained with CGRP. ROIs highlight peptidergic nerve growth in the ventral AF. CGRP staining in sham animals appears dark across the entire disc. PBS and dNP+ groups display increased CGRP positivity across many regions in the disc (entire disc scale bar = 500 μm & ROI scale bar = 100 μm). (C) PGP9.5 positive staining by region. Discs were manually broken up into regions, as done for DAPI staining. PBS and dNP+ animals had a significant increase in staining in the dorsal AF (DAF) compared to sham animals. dNP+ animals had a significant increase in PGP9.5 staining in the inner 2/3 of the ventral AF compared to sham animals. (D) Combined PGP9.5 positive staining across the entire disc. There was a significant increase in PGP9.5 staining in the PBS and dNP+ groups when compared to sham. (E) CGRP positive staining by disc region. There is a significant increase in CGRP positivity in the inner 2/3 of the VAF, NP, and DAF in the PBS group compared to sham. dNP+ animals displayed an increase in CGRP positive staining in the inner 2/3 of the ventral AF and dorsal AF compared to sham. (F) Combined CGRP positive staining across the entire disc. There was a significant increase in CGRP staining in the PBS group when compared to sham. PGP and CGRP positivity were analyzed with the Kruskal–Wallis test and Dunn's post hoc test. * = p < 0.05.
FIGURE 10
FIGURE 10
Disc volume and grip strength exhibit significant relationships both with and without dNP+. (A) Correlation between normalized disc volume and normalized grip strength shows a significant relationship. (B) Correlation between normalized disc volume and normalized grip strength without dNP+ shows a significant relationship. Correlations calculated using the Pearson correlation coefficient. The solid black line shows a linear regression line. One animal from the dNP+ group due to its normalized disc volume is an outlier.

Similar articles

References

    1. James S. L., Abate D., Abate K. H., et al., “Global, Regional, and National Incidence, Prevalence, and Years Lived With Disability for 354 Diseases and Injuries for 195 Countries and Territories, 1990–2017: A Systematic Analysis for the Global Burden of Disease Study 2017,” Lancet 392, no. 10159 (2018): 1789–1858. - PMC - PubMed
    1. Hestbaek L., Leboeuf‐Yde C., and Manniche C., “Low Back Pain: What Is the Long‐Term Course? A Review of Studies of General Patient Populations,” European Spine Journal 12, no. 2 (2003): 149–165, 10.1007/s00586-002-0508-5. - DOI - PMC - PubMed
    1. Martin B. I., Deyo R. A., Mirza S. K., et al., “Expenditures and Health Status Among Adults With Back and Neck Problems,” Journal of the American Medical Association 299, no. 6 (2008): 656–664. - PubMed
    1. Racine M., “Chronic Pain and Suicide Risk: A Comprehensive Review,” Progress in Neuro‐Psychopharmacology and Biological Psychiatry 87 (2018): 269–280, 10.1016/j.pnpbp.2017.08.020. - DOI - PubMed
    1. Shmagel A., Foley R., and Ibrahim H., “Epidemiology of Chronic Low Back Pain in US Adults: Data From the 2009‐2010 National Health and Nutrition Examination Survey,” Arthritis Care and Research 68, no. 11 (2016): 1688–1694, 10.1002/acr.22890. - DOI - PMC - PubMed

LinkOut - more resources