This is a preprint.
scDrugMap: Benchmarking Large Foundation Models for Drug Response Prediction
- PMID: 40386575
- PMCID: PMC12083700
scDrugMap: Benchmarking Large Foundation Models for Drug Response Prediction
Abstract
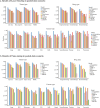
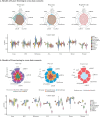
Drug resistance remains a significant barrier to improving the effectiveness of cancer therapies. To better understand the biological mechanisms driving resistance, single-cell profiling has emerged as a powerful tool for characterizing cellular heterogeneity. Recent advancements in large-scale foundation models have demonstrated potential in enhancing single-cell analysis, yet their performance in drug response prediction remains underexplored. In this study, we developed scDrugMap, an integrated framework for drug response prediction that features both a Python command-line tool and an interactive web server. scDrugMap supports the evaluation of a wide range of foundation models, including eight single-cell foundation models and two large language models (LLMs), using large-scale single-cell datasets across diverse tissue types, cancer types, and treatment regimens. The framework incorporates a curated data resource consisting of a primary collection of 326,751 cells from 36 datasets across 23 studies, and a validation collection of 18,856 cells from 17 datasets across 6 studies. Using scDrugMap, we conducted comprehensive benchmarking under two evaluation scenarios: pooled-data evaluation and cross-data evaluation. In both settings, we implemented two model training strategies-layer freezing and fine-tuning using Low-Rank Adaptation (LoRA) of foundation models. In the pooled-data evaluation, scFoundation outperformed all others, while most models achieved competitive performance. Specifically, scFoundation achieved the highest mean F1 scores of 0.971 and 0.947 using layer-freezing and fine-tuning, outperforming the lowest-performing model by 54% and 57%, respectively. In the cross-data evaluation, UCE achieved the highest performance (mean F1 score: 0.774) after fine-tuning on tumor tissue, while scGPT demonstrated superior performance (mean F1 score: 0.858) in a zero-shot learning setting. Together, this study presents the first comprehensive benchmarking of large-scale foundation models for drug response prediction in single-cell data and introduces a user-friendly, flexible platform to support drug discovery and translational research.
Keywords: Computational Drug Discovery; Drug Resistance; Drug Response Prediction; Foundation Models; Low-Rank Adaptation; Single-cell Profiling; Zero-shot Learning; scDrugMap.
Conflict of interest statement
Competing interests The authors declare no competing interests.
Figures


Similar articles
-
Benchmarking foundation cell models for post-perturbation RNA-seq prediction.BMC Genomics. 2025 Apr 23;26(1):393. doi: 10.1186/s12864-025-11600-2. BMC Genomics. 2025. PMID: 40269681 Free PMC article.
-
SensitiveCancerGPT: Leveraging Generative Large Language Model on Structured Omics Data to Optimize Drug Sensitivity Prediction.bioRxiv [Preprint]. 2025 Mar 3:2025.02.27.640661. doi: 10.1101/2025.02.27.640661. bioRxiv. 2025. PMID: 40060567 Free PMC article. Preprint.
-
Enhancing semantical text understanding with fine-tuned large language models: A case study on Quora Question Pair duplicate identification.PLoS One. 2025 Jan 10;20(1):e0317042. doi: 10.1371/journal.pone.0317042. eCollection 2025. PLoS One. 2025. PMID: 39792917 Free PMC article.
-
Benchmarking pathology foundation models: Adaptation strategies and scenarios.Comput Biol Med. 2025 May;190:110031. doi: 10.1016/j.compbiomed.2025.110031. Epub 2025 Apr 2. Comput Biol Med. 2025. PMID: 40179809
-
Utilizing large language models for gastroenterology research: a conceptual framework.Therap Adv Gastroenterol. 2025 Apr 1;18:17562848251328577. doi: 10.1177/17562848251328577. eCollection 2025. Therap Adv Gastroenterol. 2025. PMID: 40171241 Free PMC article. Review.
References
-
- Schwaederle M. et al. Association of Biomarker-Based Treatment Strategies With Response Rates and Progression-Free Survival in Refractory Malignant Neoplasms: A Meta-analysis. JAMA Oncol 2, 1452–1459 (2016). - PubMed
Publication types
Grants and funding
LinkOut - more resources
Full Text Sources
