. 2025 Apr 30;14(4):1197-1211.
doi: 10.21037/tlcr-2024-1068. Epub 2025 Apr 25.

Diagnostic accuracy of serum biomarkers MMP11 and SPP1 in non-small cell lung cancer: an analysis of sensitivity, specificity, and area under the curve

Affiliations

Diagnostic accuracy of serum biomarkers MMP11 and SPP1 in non-small cell lung cancer: an analysis of sensitivity, specificity, and area under the curve

Minha Lea Yoon et al. Transl Lung Cancer Res. .

Abstract

Background: Non-small cell lung cancer (NSCLC) represents the vast majority of lung cancer cases, comprising 80-85% of all diagnoses, and continues to be a primary contributor to cancer-related deaths. Early detection is essential for improving patient outcomes, yet current diagnostic markers lack both sensitivity and specificity. This study aims to identify novel biomarkers that could enhance early diagnosis.

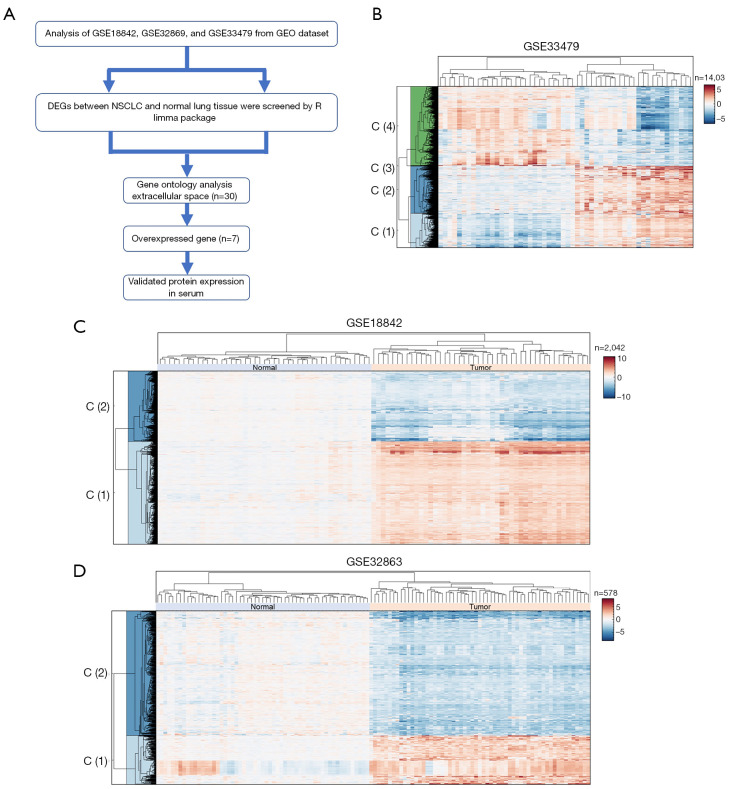
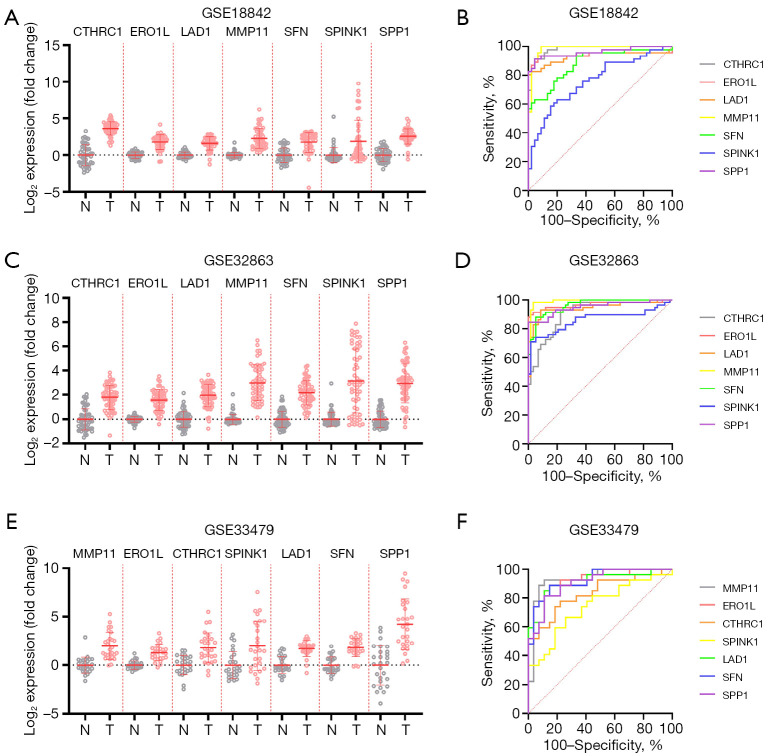
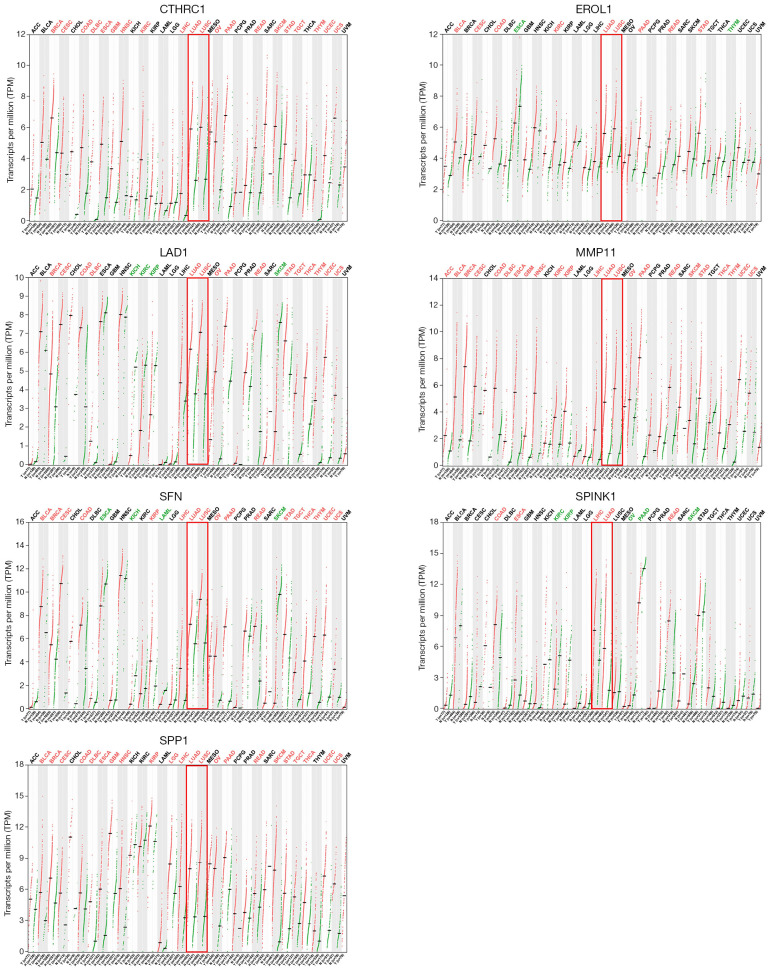
Methods: We conducted a comprehensive gene expression analysis of three NSCLC datasets (GSE33479, GSE18842, and GSE32863) and identified seven genes with relevance to the extracellular region and space: MMP11, SPP1, ERO1L, CTHRC1, SPINK1, LAD1, and SFN. We further assessed these markers through serum protein analysis involving 200 NSCLC patients and 200 healthy controls, employing receiver operating characteristic (ROC) curve analysis to evaluate their diagnostic efficacy.

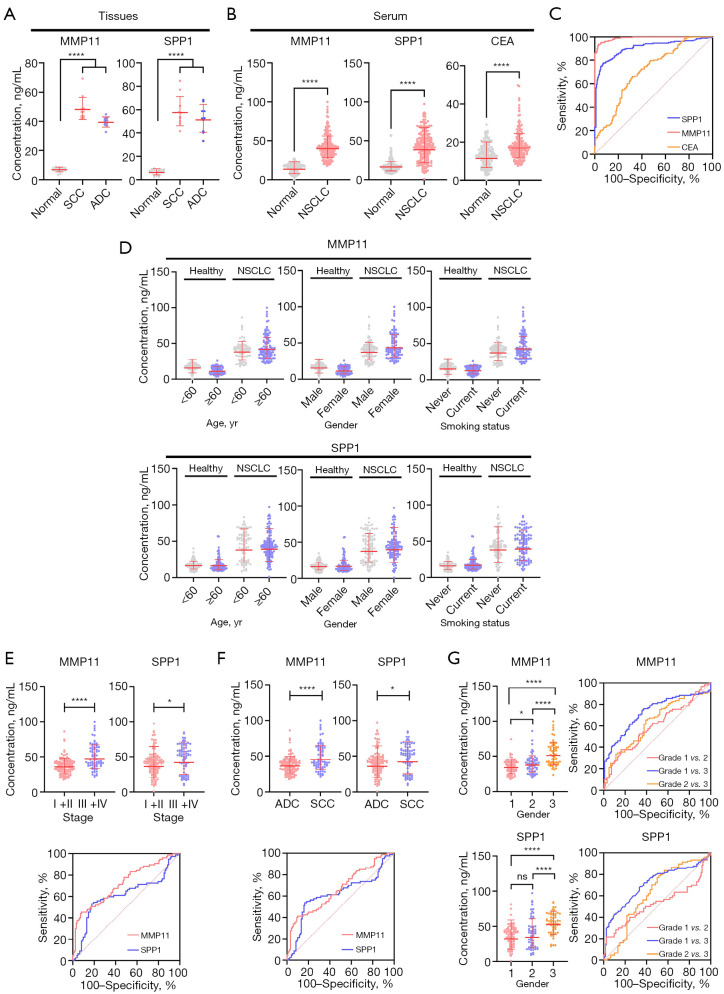
Results: Among the identified genes, MMP11 and SPP1 exhibited significant upregulation and strong discriminatory power in NSCLC tissues, achieving area under the curve (AUC) values exceeding 0.9. Serum protein levels of MMP11 and SPP1 were significantly higher in NSCLC patients compared to healthy controls. ROC curve analysis confirmed the diagnostic potential of MMP11 (AUC: 0.9896) and SPP1 (AUC: 0.9053), both outperforming the existing marker carcinoembryonic antigen (CEA) (AUC: 0.7109). MMP11 demonstrated sensitivity of 94.53% and specificity of 94.97%, while SPP1 showed sensitivity of 83.17% and specificity of 83.84%. In contrast, CEA exhibited a sensitivity of 66.83% and specificity of 67.69%.

Conclusions: The results indicate that MMP11 and SPP1, detectable in serum, may serve as valuable non-invasive biomarkers for the early diagnosis of NSCLC, particularly within health screening contexts. However, further research within larger and more diverse cohorts is imperative to validate these biomarkers and investigate the mechanisms underlying MMP11 and SPP1 expression in NSCLC. This study highlights the potential of these biomarkers to enhance diagnostic accuracy and improve patient outcomes in NSCLC.

Keywords: MMP11; Non-small cell lung cancer (NSCLC); SPP1; early detection; serum biomarker.


Conflict of interest statement

Conflicts of Interest: All authors have completed the ICMJE uniform disclosure form (available at https://tlcr.amegroups.com/article/view/10.21037/tlcr-2024-1068/coif). The authors have no conflicts of interest to declare.

Figures

Figure 1
Figure 1
Comprehensive analysis of NSCLC biomarkers across three datasets. (A) outlines the bioinformatics workflow used to analyze gene expression profiles. (B-D) heatmaps of differentially expressed genes for datasets GSE33479 (B), GSE18842 (C), and GSE32863 (D) respectively, with red indicating high expression levels and blue indicating low expression levels. C, cluster; DEG, differentially expressed gene; GEO, Gene Expression Omnibus; GSE, gene expression data series; NSCLC, non-small cell lung cancer.
Figure 2
Figure 2
Comparative gene expression analysis and diagnostic power assessment in NSCLC. (A,C,E) Log2 fold changes in mRNA levels of MMP11, SPP1, ERO1L, CTHRC1, SPINK1, LAD1, and SFN across normal (N) and tumor (T) samples within datasets GSE18842 (A), GSE32863 (C), and GSE33479 (E), respectively. (B,D,F) ROC curve analyses for each gene within datasets GSE18842 (B), GSE32863 (D), and GSE33479 (F), respectively. GSE, gene expression data series; NSCLC, non-small cell lung cancer.
Figure 3
Figure 3
Differential expression of selected genes in TCGA dataset. Log2 fold change of TPM in mRNA expression levels of ERO1L, CTHRC1, SPINK1, LAD1, SFN, MMP11, and SPP1 in tumor compared with normal in TCGA LUAD and LUSC. LUAD, lung adenocarcinoma; LUSC, lung squamous cell carcinoma; TCGA, The Cancer Genome Atlas; TPM, transcript per million;
Figure 4
Figure 4
Analysis of MMP11 and SPP1 protein concentrations in serum as early diagnostic markers for NSCLC. (A) Scatter plots showing significantly elevated tissue levels of MMP11 and SPP1 in NSCLC patients compared to paired non-malignant tissues. (B) Scatter plots showing significantly elevated serum levels of MMP11 and SPP1 in NSCLC patients compared to healthy controls. The conventional marker CEA was also elevated, but to a lesser extent. (C) ROC curve analysis demonstrating robust discriminatory ability of MMP11 and SPP1 with high AUC values, indicating superior diagnostic potential compared to CEA. (D) Scatter plots showing no significant differences in serum levels of MMP11 and SPP1 based on age, gender, or smoking status in both healthy individuals and NSCLC patients. (E,F) Scatter plots revealing significantly higher levels in stages III and IV compared to stages I and II (E), and higher expression levels of MMP11 and SPP1 in squamous cell carcinoma compared to adenocarcinoma (F). ROC curve analysis demonstrates the discriminatory ability of MMP11 and SPP1 for NSCLC tumor stages and histological subtypes using AUC values (E,F, low panel). (G) Scatter plot shows serum MMP11 and SPP1 levels in NSCLC patients of different grades (upper panel). ROC curve analysis for serum MMP11 and SPP1 in distinguishing high-grade from low-grade NSCLC (low panel). All other data were analyzed using the one-way ANOVA and Student’s t-test. Statistical significance is indicated as asterisks in figures: *, P<0.05 and ****, P<0.0001. ADC, adenocarcinoma; ANOVA, analysis of variance; AUC, area under the curve; CEA, carcinoembryonic antigen; NSCLC, non-small cell lung cancer; ROC, receiver operating characteristic; SCC, squamous cell carcinoma; yr, years.

Similar articles

References

    1. Siegel RL, Miller KD, Jemal A. Cancer statistics, 2020. CA Cancer J Clin 2020;70:7-30. 10.3322/caac.21590 - DOI - PubMed
    1. Duma N, Santana-Davila R, Molina JR. Non-Small Cell Lung Cancer: Epidemiology, Screening, Diagnosis, and Treatment. Mayo Clin Proc 2019;94:1623-40. 10.1016/j.mayocp.2019.01.013 - DOI - PubMed
    1. Kratzer TB, Bandi P, Freedman ND, et al. Lung cancer statistics, 2023. Cancer 2024;130:1330-48. 10.1002/cncr.35128 - DOI - PubMed
    1. Peters AA, Wiescholek N, Müller M, et al. Impact of artificial intelligence assistance on pulmonary nodule detection and localization in chest CT: a comparative study among radiologists of varying experience levels. Sci Rep 2024;14:22447. 10.1038/s41598-024-73435-3 - DOI - PMC - PubMed
    1. Gazdar AF, Bunn PA, Minna JD. Small-cell lung cancer: what we know, what we need to know and the path forward. Nat Rev Cancer 2017;17:725-37. 10.1038/nrc.2017.87 - DOI - PubMed

LinkOut - more resources